On July 1, the US hit a remarkable economic milestone. We are now in the nation’s longest-ever period of growth without a recession. America has clocked 122 consecutive months of economic expansion.
Like all record-breaking streaks, this one started modestly. The green shoots appeared in the summer of 2009, as the economy finally began to scratch back from the Great Recession. We were officially out of the woods by December of that year.
For all its magnificence, many Americans have been less-than-impressed by the expansion. That sentiment may stem from this expansion’s slow-but-steady nature, which is in stark contrast to other recent upswings.
Think back to the 1990s. During the latter half of that decade, we were riding high on the dot com bubble, investors were driving stock prices to record highs, and everything was gangbusters. Until the crash came. The white-hot pace of that last expansion may be preventing us from appreciating our current blessing: A solid, albeit shallow, recovery from an awful 18-month recession.
In the past, we’ve experienced recoveries in the 4%, 5%, and 6% range. The current expansion, in contrast, is running between 1.5% and 3% annual growth. That leaves people feeling blah. I’m a big believer, however, in the fable of the tortoise and the hare – slow and steady wins the race.
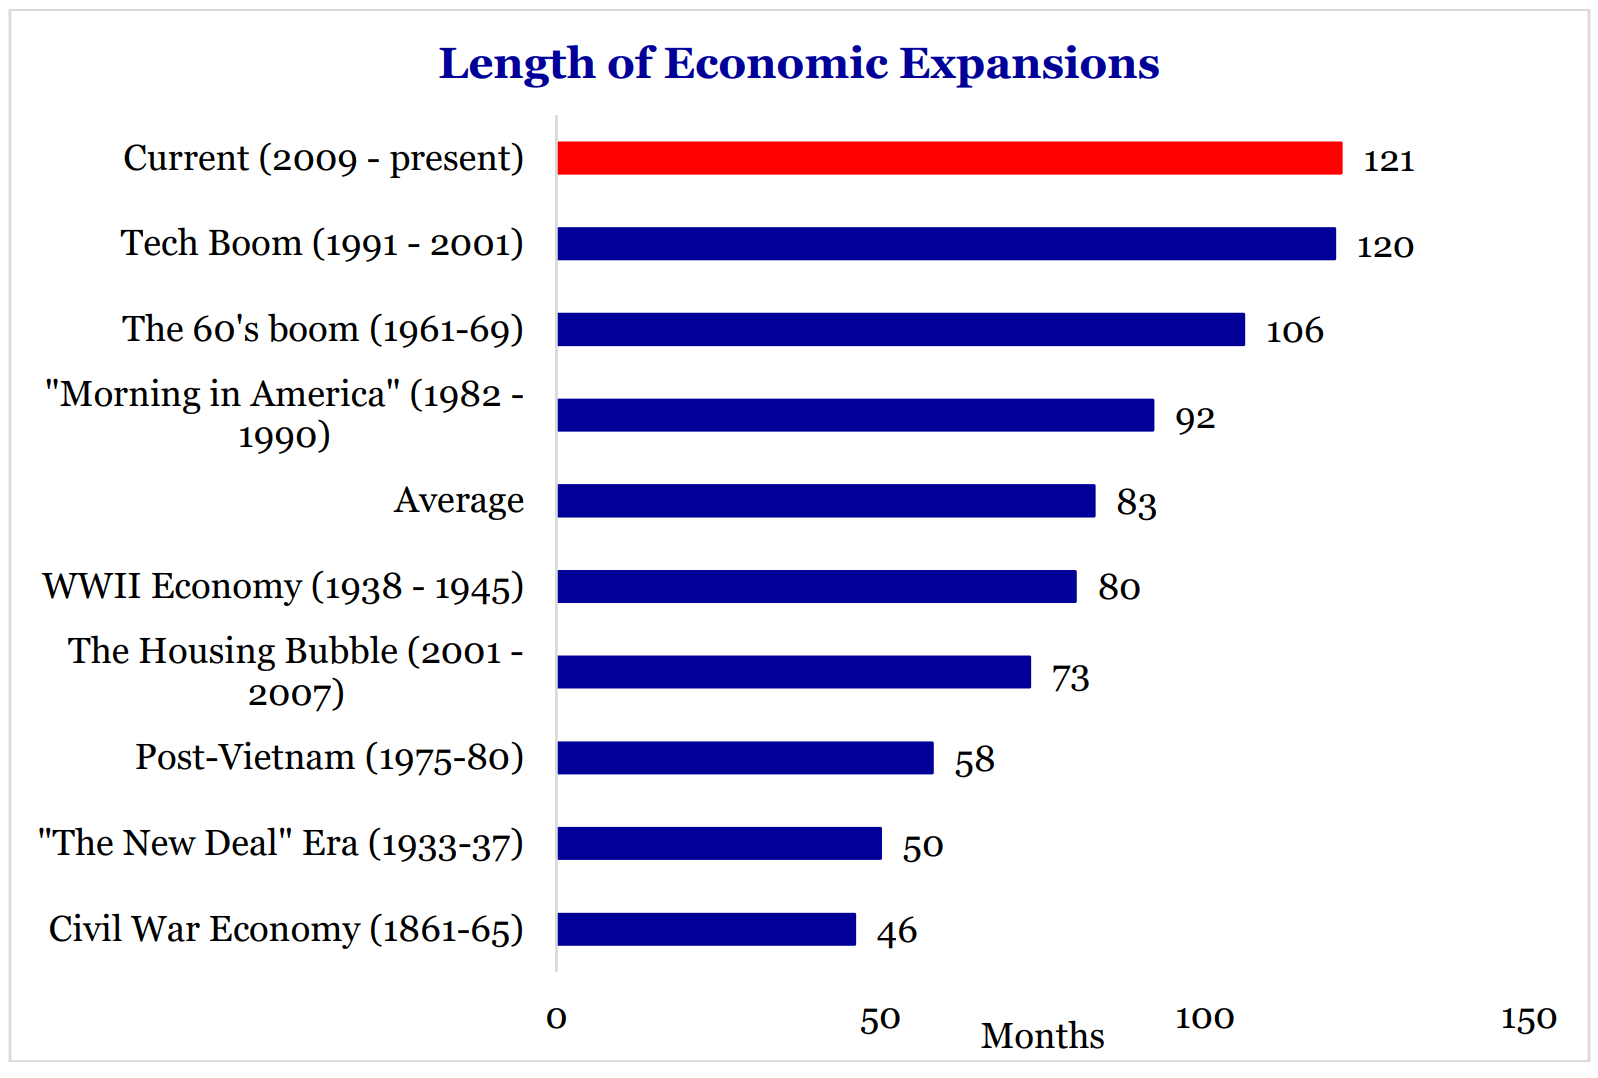
Chart from Strategas.
America’s capitalist economy is built to foster this kind of longitudinal growth. Our country is like no other. The capitalist environment in which we live is made possible by a variety of factors, some uniquely American:
1. The Rule of Law. This is our unshakable foundation. Our laws provide clear, evenly applied rules for conducting business. The law also protects our property rights.
2. Tax Incentives. Our tax system, whether you approve or disapprove, incentivizes business creation and the building of long-term wealth.
3. Freedom. In America, we have freedom of speech, free and open elections, equal protections, and, most importantly for our discussion, a free market economy.
4. Entrepreneurial Mindset. The US is the global center of entrepreneurship and innovation.
5. Hard Work. We have a population that wakes up every morning and strives for a better future because they know it’s possible. We live in a system that allows for growth. America offers jobs that come with opportunities to advance and access to a vast education system that enables people to expand their skills and value.
Simply put, our system allows every American to strive for a bigger, better tomorrow. The best place to work isn’t Apple, Microsoft or Google. It’s in the US. Our freedom and independence give us all the opportunity for growth, both individually and as a country.
When evaluating our current economic expansion, it’s important to remember that we are all playing the long game. While details do matter, it’s helpful to zoom out and look at the bigger economic picture – the market over months and years and decades versus just days or weeks.
Take a look at this chart, which shows the comparative strength of our current economic expansion against previous growth periods:
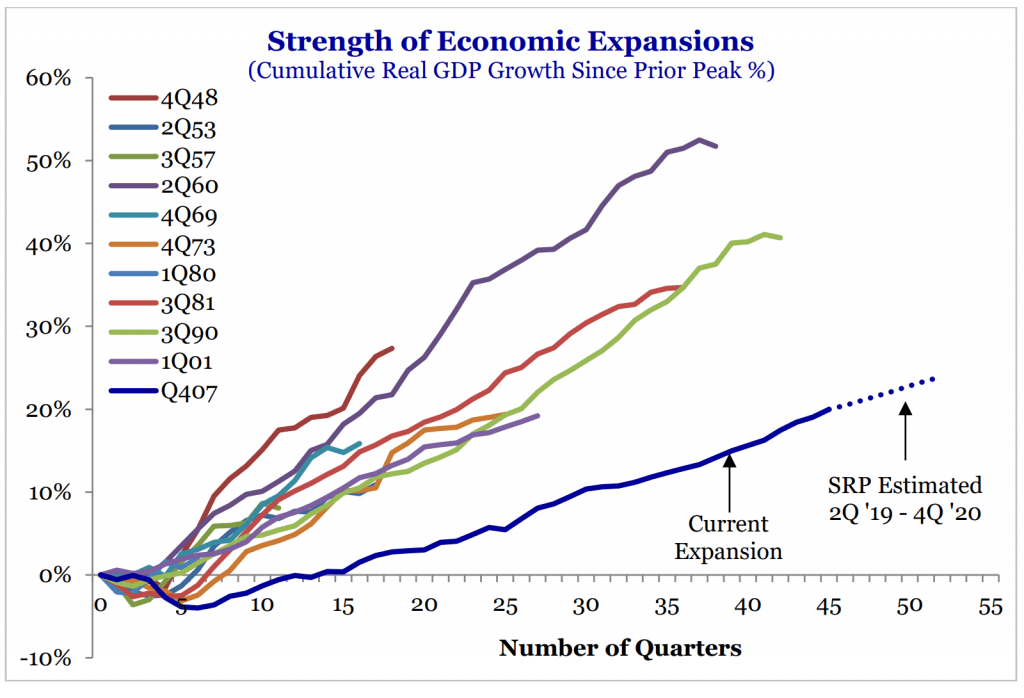
During the 1949-53 period, we were coming out of World War II. Our growth came largely from pent up consumer demand and averaged nearly 7% per year. In 1961-1969, a roughly eight-year expansion offered up 4.9% average annual growth. Beginning in 1982 and going through 1990, we were at 4.3% annual growth and almost 40% above the prior economic peak. From 1991 to 2001, we grew at 3.6% with a 50% expansion above the previous economic peak. That was due in no small part to the dot com boom.
And here we are today. We’re 122 months away from the depths of 2009, and we’ve barely averaged above 2%. We have skimmed just over 20% above the prior economic peak. That’s a pretty good definition of slow and shallow growth.
I suspect this slow growth is the result of a sort of a collective PTSD on the part of investors and financial institutions, which two massive recessions in 2000-01 and 2007-08. Each rocked our collective confidence and scared banks into keeping capital very tight for many years into the current expansion.
Still, I look at this chart and see a very solid 10-year period. We have what I would call a “plow horse economy,” meaning that although we’re not running a sprint, we keep breaking new ground (and may for some time to come).
But rather than bemoan the mundane nature of this recovery, I choose to bask in what we have accomplished and where we may be headed.
Recently, Robert Doar, the president, and Morgridge Scholar at the American Enterprise Institute, offered some commentary on where we are economically, and it deals with everyday Americans:
“Here’s a big idea – something to keep in mind as you hear about inequality and mobility. The middle class is shrinking, which might make it look like capitalism is failing workers. But the lower class is shrinking, too. Meanwhile, the upper class is bigger than it has ever been.
About 28% of households now make more than $100,000 per year, more than double the rate of 40 years ago. More than half of Americans will be part of the top 10% of earners at some point in their lifetimes. Contrary to much contemporary rhetoric, workers in the US are getting richer, not poorer, as competition in the free market allows them to purchase a greater variety of goods for less money than ever before.”
Do we ever hear this side of the coin? Typically, no. Most talking heads would have you believe that jobs are vanishing, and wages are drying up, leaving middle- and low-income earners to bear the brunt of losses. We hear a lot about “the working poor” versus the 1%’ers. Is this a fair comparison?
While the middle-income class is indeed shrinking, so too is the lower-income class. When viewed in this light, the growth of the higher-income class isn’t so bad after all.
Consider also that about 28% of all US households now earn more than $100,000 per year. This data point represents a massive increase, up from 19.9% in 2014 and more than double the percentage of 40 years ago.
Perhaps more stunning is that more than 50% of Americans (or roughly 150 million people) will, at some point during their working careers, be in the top 10% of earners. More than half, folks, will achieve significant financial success in our country. This statistic means that the majority of US workers have done something very right economically.
Contrary to what we hear on the debate stages and in news reports, if you are willing to work in the US, you will likely get richer. The numbers support that, and I believe in numbers.
Some also argue that $100,000 ain’t what it used to be. But annual earnings of $100,000 provide comfort and room to save to be a happy retiree. Remember, many happy retirees have $500,000 socked away and spend an average of between $5,000 to $5,500 a month (adjusted for inflation from previous 2014 numbers) based on research done by my colleague Wes Moss. At a 15% tax rate, happy retirees can live off of somewhere between $75,000 to $80,000 for a couple.
Back to macro-level growth, I’m fascinated by our economic story. I love the study of economics because it’s multifaceted – part science, part philosophy, part art and part psychology (especially when it comes to emotions around consumer incentives, investing, and the P-word, or politics). Sure, you have to be able to crunch the data from segments like retail spending and housing starts, but there’s more to the whole than the sum of its parts.
Economics is an ever-changing landscape and understanding the past and the present can give us a peek into what’s to come.
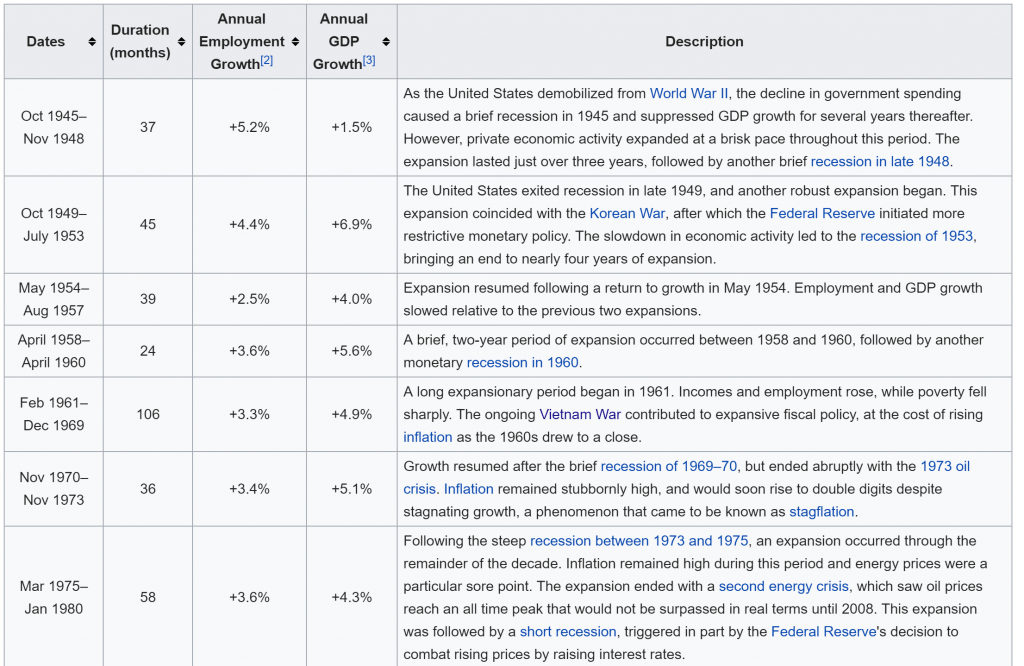
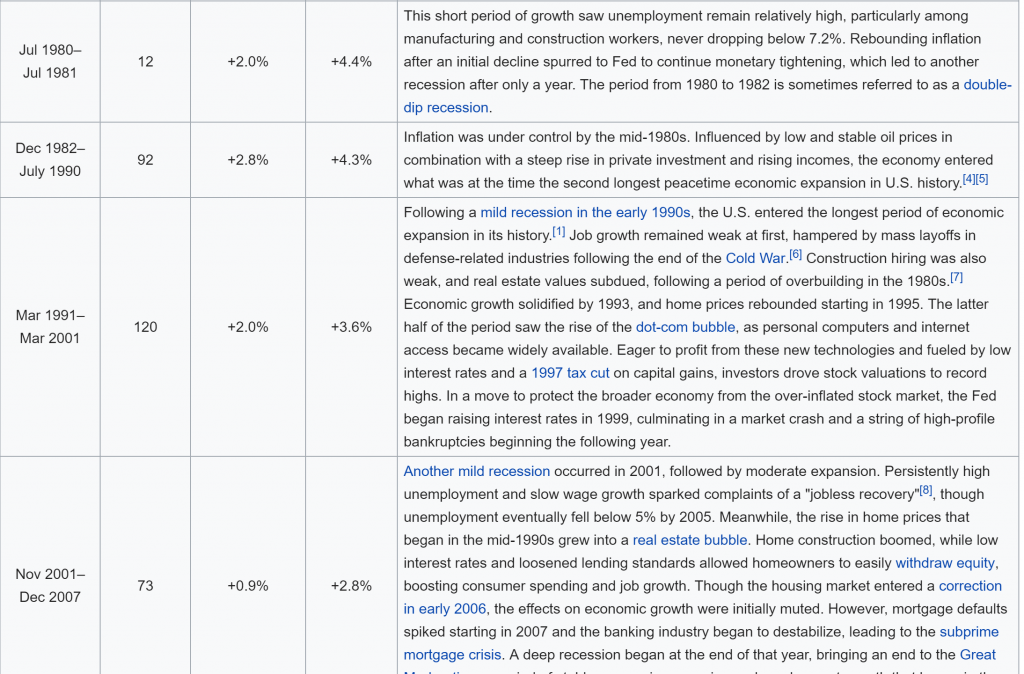
Consider this chart, which outlines the periods of economic expansion, the annual employment growth and annual GDP growth:
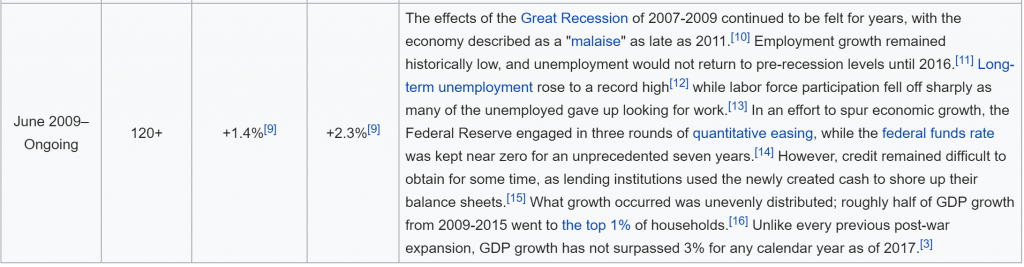
Taking a step back, it may be difficult to understand all of the American Gravitational Good that has happened and is happening. For instance, jobless claims rose at last print, showing an unfavorable upward trend. Manufacturing in the US is a slowing trend, too. The US 10YR Treasury Bond is flirting with a mark below 2%, which signals a slowdown and that the Federal Reserve (Fed) may need to lower rates.
Yet, the length of unemployment has fallen to 9.1 weeks, and wages have risen to the 3%-plus range. From a Wall Street Journal report from June, “household net worth [the total value of household assets minus their liabilities] grew 4.5% in the first quarter to $108.6 trillion, offsetting a 3.7% decline in the fourth quarter of 2018.” This number represents the biggest quarterly gain since the fourth quarter of 2004. According to the report, “much of that gain comes from a 12.4% increase in the value of household holdings of corporate equities due to the recovery in the stock market.”
And, the S&P 500 is “up 12.8% on the year after falling 6.2% in 2018.” This number represents the most massive jump in 14 years, almost $110 trillion, while debt payments as a percentage of income is the lowest it’s been in 40 years.
Bottom line: this is good news.
As we come off ten solid, plow horse economic years in the US, you may wonder whether we can continue for another ten? Probably not. But the expansion doesn’t have to end tomorrow simply because it’s been around for a decade. We could see another year, two or three. Only time will tell. Sooner or later there will be another recession. That’s both normal and OK. Every expansion is born phoenix-like from the ashes of recession.
It’s all part of the never-ending economic circle of life. And that’s a beautiful thing.