Who doesn’t love dividends? Every dollar counts in life and investing and snagging quarterly checks from your investments – even modest checks — adds up over time. If you practice income investing, dividends can make a significant difference in your long-term investment yield.
Income investing prioritizes generating cash flow from your assets. The income you receive from stock dividends, bond interest, and other disbursements is reinvested during your working years to help accelerate the growth for your portfolio. When retirement rolls around, the cash flow from your investments is redirected into your bank account to give you a “paycheck” to help fund your spending needs.
If you’ve ever wondered how dividend-paying stocks compare to their non-dividend paying counterparts over the long haul, then you’ve come to the right place.
If we look at data going all the way back to 1972, dividend growers outperformed both their counterparts and the S&P 500 Index.
Let’s look at the data for five categories of stocks: Dividend growers and initiators, all dividend-paying stocks, dividend payers with no change in dividends, non-dividend-paying stocks, and dividend cutters or eliminators. And, let’s compare these graphs to the S&P 500.
Take a look:
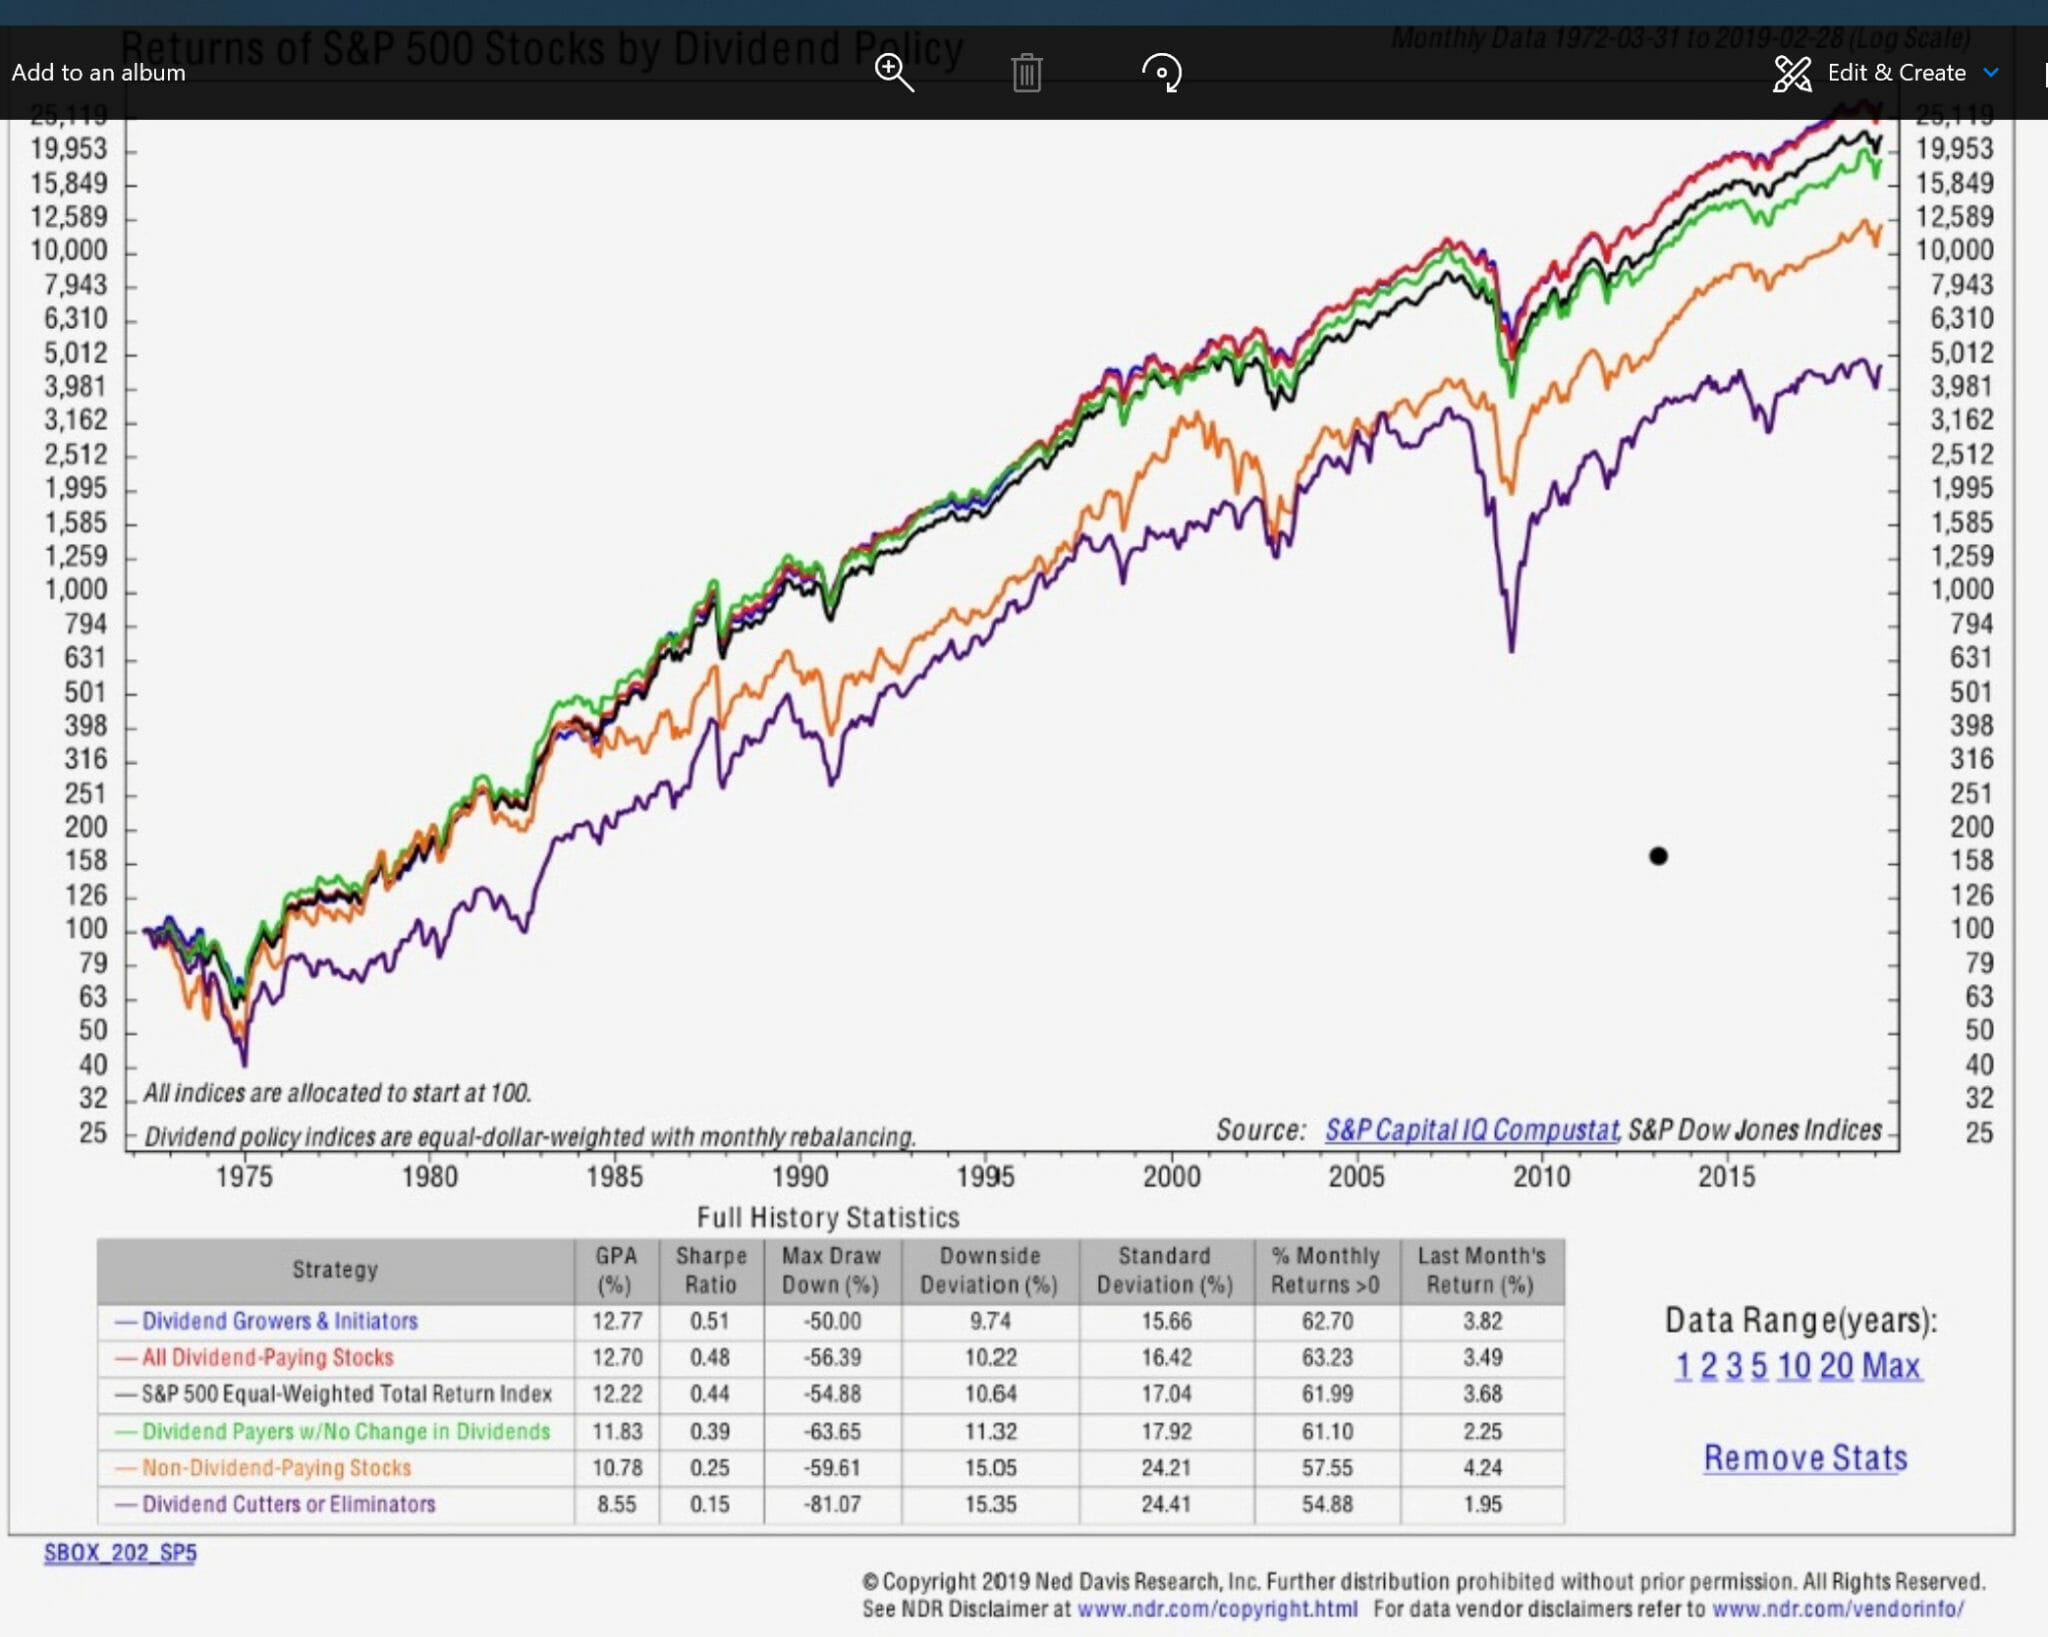
In the last 47 years or so, the S&P 500 total return, when equally weighted, returned 12.2%. (The S&P’s normal cap-weighted total return was 10.4% per annum.) Dividend non-growers returned 10.8%, and dividend cutters and eliminators returned only 8.5%. On the other hand, dividend growers and initiators returned 12.77%, besting even the equally weighted S&P.
When we say, “equally weighted,” it means giving the same “weight,” or importance, to each component in a portfolio or index fund. In the case of the “S&P 500 equal weighted index”, the smallest companies in the index are given equal weight to the largest companies. In this way, the playing field is leveled. On the normal cap-weighted S&P, Apple has a 3.58% weighting, while Atlanta’s Equifax has a 0.06 weighting. These numbers mean that Apple has almost sixty times the influence of Equifax on the S&P 500 (3.58/0.06 = 59). But when we use equal weighting, we level the playing field of the individual players – whether giant corporations or merely large outfits.
Now, let’s look at the growth of $100 since 1972 for growers and initiators, non-growers, and cutters and eliminators alongside the S&P 500 total return:
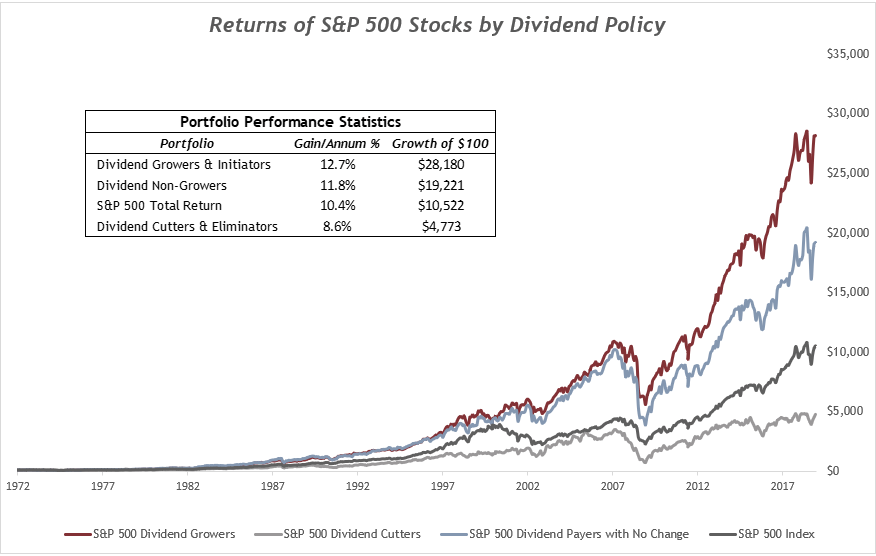
Data sourced from NDR.
So, $100 in the S&P 500 grew to $10,522, but dividend growers and initiators grew to $28,180!
That’s quite a difference.
I hope this data gives you a sense of some of the benefits of owning dividend-paying stocks – if you weren’t already on that bandwagon. In addition to potentially offering a better total return, this type of stock could give you lower volatility and more consistent income for spending in retirement. After all, once you call it a career, those quarterly checks can go straight into your pocket as income.
Do you want to dip into dividend-paying stocks but aren’t sure where to start? If so, here’s a quick primer for choosing companies for their dividend payouts.
For starters, not all blue-chip stocks were created equal. Before we make an income-based investment, we want to take a good look under the hood to see what’s really there. We have to consider more than the flashy exterior.
Understandably, the near-infinite amount of ways to screen companies can be daunting – there are hundreds of different variables, inflection points of these variables, and so forth. So, here’s a rough sketch of how we at Capital Investment Advisors choose stocks.
Start your search by looking at the S&P 500 universe. Screen for all that fit into the $5 billion category and above. Then, whittle down your list by selecting only the companies that have reasonable forward P/E (price to earnings) multiples in the realm of 20x or less. Once you’ve done that, eliminate the companies that aren’t healthily growing their dividends – you’re looking for 4% growth or more each year.
Next, screen for a particular free cash flow (FCF) level relative to the company’s size and debt levels. This metric is the company’s operating cash flow, or capital expenditures minus acquisitions. We use this data point because it’s a good way to get a handle on the cash generated by the business after adjusting for the cost needed for ongoing investments. The reason we exclude acquisitions is that they tend to be one-time expenses and don’t accurately reflect the “iron-clad” number required to keep the business going. And, FCF is what can be used to buy back stocks, pay dividends, reduce debt, buy other companies and the like.
For the final step in your selection process, take a look at other metrics that measure the company’s earnings relative to debt. These will help you get a sense of how the company is performing.
What you should have now is a basket of companies that are attractively priced with nicely growing dividends – those dividend growers and initiators we talked about above. These are the kind of companies I want to own both in a market upswing and a downturn, and I want to have them in my pocket for years to come.