The difference between America’s “haves” and “have-nots” is growing. Income inequality is a rising problem in the US and has gotten worse “in every state since the 1970s,” according to the Economic Policy Institute (EPI), a nonpartisan think tank devoted to informing fiscal policy discussions.
Income disparity or inequality refers to the difference between the nation’s top earners and the rest of us. Case in point – recent data from the EPI indicate that Americans in the top 1% make an average of $1.32 million per year while the average income of the remaining 99% hovers around $50,100.
“In 2015, a family in the top 1 percent nationally received, on average, 26.3 times as much income as a family in the bottom 99 percent,” the EPI reports.
EPI data was analyzed by howmuch.net to determine which states have the greatest income disparity. To answer this question, the analysts at howmuch.net compared the top 1% of earners to the bottom 99% of all states and ranked them by the size of the disparity.
Here’s what they discovered – the largest income inequality in the US tended to fall in regions in the Northeast and, to some degree, the West Coast.
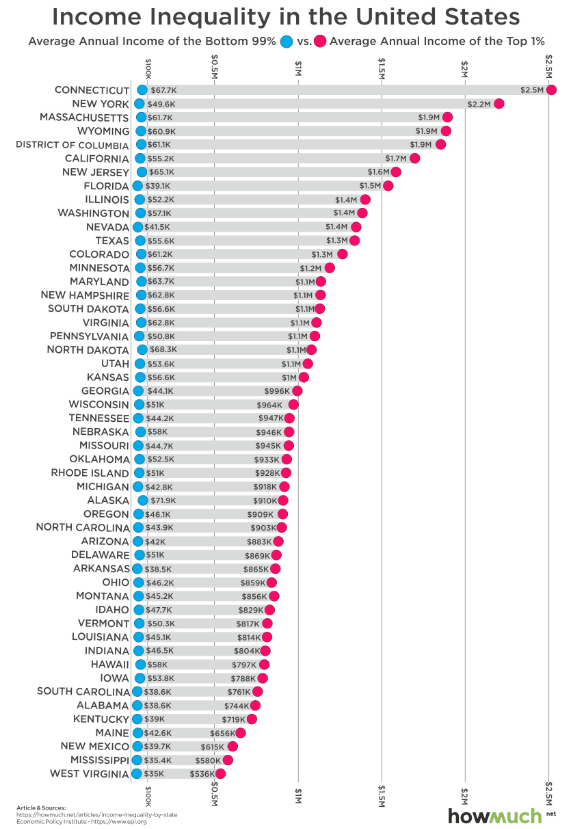
Let’s take a look at the top ten places howmuch.net identified as having the most considerable income inequality in the US:
Connecticut
Average annual income of the bottom 99%: $67,700
Average annual income of the top 1%: $2.5 million
New York
Average annual income of the bottom 99%: $49,600
Average annual income of the top 1%: $2.2 million
Massachusetts
Average annual income of the bottom 99%: $61,700
Average annual income of the top 1%: $1.9 million
Wyoming
Average annual income of the bottom 99%: $60,900
Average annual income of the top 1%: $1.9 million
Washington, D.C.
Average annual income of the bottom 99%: $61,100
Average annual income of the top 1%: $1.9 million
California
Average annual income of the bottom 99%: $55,200
Average annual income of the top 1%: $1.7 million
New Jersey
Average annual income of the bottom 99%: $65,100
Average annual income of the top 1%: $1.6 million
Florida
Average annual income of the bottom 99%: $39,100
Average annual income of the top 1%: $1.5 million
Illinois
Average annual income of the bottom 99%: $52,200
Average annual income of the top 1%: $1.4 million
Washington
Average annual income of the bottom 99%: $57,100
Average annual income of the top 1%: $1.4 million
Connecticut, New York and Massachusetts (the states with the biggest gaps) “have well-documented wealth inequality problems,” says the report.
“Our visualization highlights the yawning gap between the top 1 percent of earners and the bottom 99 percent,” says howmuch.net, and, “indeed, the gap is staggering.”
Now, states with the lowest wealth inequality fell toward the Southeast. West Virginia, Mississippi, Kentucky and Alabama have the smallest gaps between the wealthiest 1% and everyone else. These same states, however, “are widely known for their rural poverty and poor overall public health,” says howmuch.net, “earning some of the lowest wages anywhere in the country.”
For example, in West Virginia, the average annual income for 99% of the population is a mere $34,987.
So, the states with the lowest wealth disparity also happen to be the poorest states in the country. This, says howmuch.net, suggests one of two things: “a rising tide lifts all boats (meaning the wages of the extremely well-paid inflates what everyone else makes too), or states like West Virginia have economies that depress the wages of the top 1%, too.”
How we think about the correlation seems to matter less than understanding that income inequality is a real problem. And, some states have it better than others. Moving across state lines to earn a higher wage is but one answer. Perhaps the real answer is public policies designed to close the gaps, or at least lessen them, in every state.