Days of Thunder: Driving Through the Scary Headlines
There have been far too many scary headlines lately. The most alarming of these came in early August when Fitch downgraded the United States’ long-term credit rating to AA+ from AAA, marking only the second time in the nation’s history that its credit rating has been cut by one of the “big three” agencies. How did the stock market react? Not well. The Dow was down 0.98 percent, the S&P 500 fell 1.38 percent, and the NASDAQ dropped 2.17 percent.
Reading about the potential demise of all we hold dear isn’t great for my peace of mind or yours. With unsettling bylines bombarding our news feeds, it’s reasonable to expect people to search for ways to shelter from the storm by pulling money out of the market. But is that productive?
Logical decision-making serves us well in most life situations. My team uses logic when selecting relevant guests for our Retire Sooner podcast, my sons use logic to predict opponents’ strategies on the lacrosse field, and I use logic when helping clients plan for retirement. Calm, deductive reasoning can go a long way. This sentiment might be why it’s so challenging to go against logic as an investor when judging participation vs. perfection — even when it’s the most efficient move.
I was recently watching the 1990 Tom Cruise racing film Days of Thunder, and one of the scenes stood out as a helpful illustration of this concept. Cole Trickle (Tom Cruise) is speeding down the racetrack when a crash ahead suddenly creates a cloud of smoke. His crew chief, played by the legendary Robert Duvall, tells him over the headset to drive through the smoke, despite the scary lack of visibility. “You can drive through it. I know it. I know it in my heart,” he insists.
CUT TO: Cole successfully passes the danger and gives himself a chance at victory.
Am I saying I know in my heart what will happen to you in the stock market? No. If that were true, I’d be typing this aboard my fleet of mega yachts. I am saying that sometimes it can be helpful to master the art of driving through the scary headlines if we have faith in the historical trends of the financial system. It may not feel logical, and our survival instincts may let out primal screams of anxiety, but that’s okay. Cole had to drive through his challenge, and you may need to breathe through yours.
Earlier, I mentioned there had been two occasions when a major credit agency downgraded U.S. credit. The first was back in August of 2011 when Standard and Poor’s downgraded from AAA to AA+. Back then, the market reaction was decidedly harsher. The Dow was down 5.6 percent, the S&P 500 fell 6.7 percent, and the NASDAQ dropped 6.9 percent. Yet, despite that brutal descent, do you remember the world ending? Neither do I. My team and I ran the data to prove it. Here is how the stock market has performed since the first debt downgrade back in August of 2011:
| Price Return | Total Return | Annualized | |
| Dow Jones | 208% | 309% | 12.46% |
| S%P 500 | 276% | 375% | 13.87% |
| NASDAQ | 452% | 532% | 16.62% |
*Bloomberg data; From August 5, 2011, to August 2nd, 2023
The people who stopped the race (i.e., got out of the market) may have lost out on these returns. Frightening headlines can trigger knee-jerk reactions. It doesn’t help that we live in a twenty-four-seven news cycle. Financial reports break by the hour. There’s always some shockwave to absorb.
Do you remember all the headlines we were bombarded with in February and March of 2020?
- Stock Market Unravels as Coronavirus Ravages Global Economy
- Dow Drops Nearly 3,000 Points, as Coronavirus Collapse Continues; Worst Day Since ’87
- Oil Plunges Below Zero for First Time in Unprecedented Wipeout
Crude oil in the U.S. traded more than $40 below zero. If you’ve filled up your gas tank lately, you know that’s no longer the case. Since the market bottomed out in March 2020, the S&P 500 has seen a total return of 116 percent, more than double since the depths of COVID. Some said the market would never recover. Yet, here we are three and a half years later in a completely different economic environment.
And what about the hairy inflation headlines we’ve seen in the last few years? Listeners of my Money Matters radio show know we’ve all been consumed by that topic.
- S. Inflation Reached a New 40-Year High in June of 9.1 Percent
- Gas Prices Surge to $5 Per Gallon, Reaching All-Time High: AAA
- Federal Reserve Raises Rates for 11th Time to Fight Inflation But Gives No Clear Sign of Next Move
We witnessed the highest inflation point in four decades on July 13, 2022, but since then, the S&P 500 is up almost 23 percent (as of July 31, 2023).
Historical data has consistently shown that the stock market has weathered various storms over the years, including economic downturns, geopolitical tensions, and health crises. Attempting to time the market based on news can be a futile endeavor, even for seasoned financial analysts. Look no further than the end of 2022 when slews of “Wall Street experts” called for a recession and a stock market pullback in 2023. Do these headlines sound familiar?
- Why Everyone Thinks a Recession Is Coming in 2023
- If There Is A Recession in 2023, Some Cities Could Take a Decade To Recover
- Economists Place 70% Chance for U.S. Recession in 2023
Investors who react hastily to alarming headlines might buy high and sell low, a pattern that can erode their portfolio’s value over time. Adopting a long-term investment strategy can allow investors to capitalize on the power of compounding. Over extended periods, even small market gains can accumulate significantly. Missing out on these due to impulsive reactions can hinder the potential growth of one’s portfolio.
My team at Capital Investment Advisors and I put together a study about participation vs. perfection that can be a helpful way to understand the dynamic.
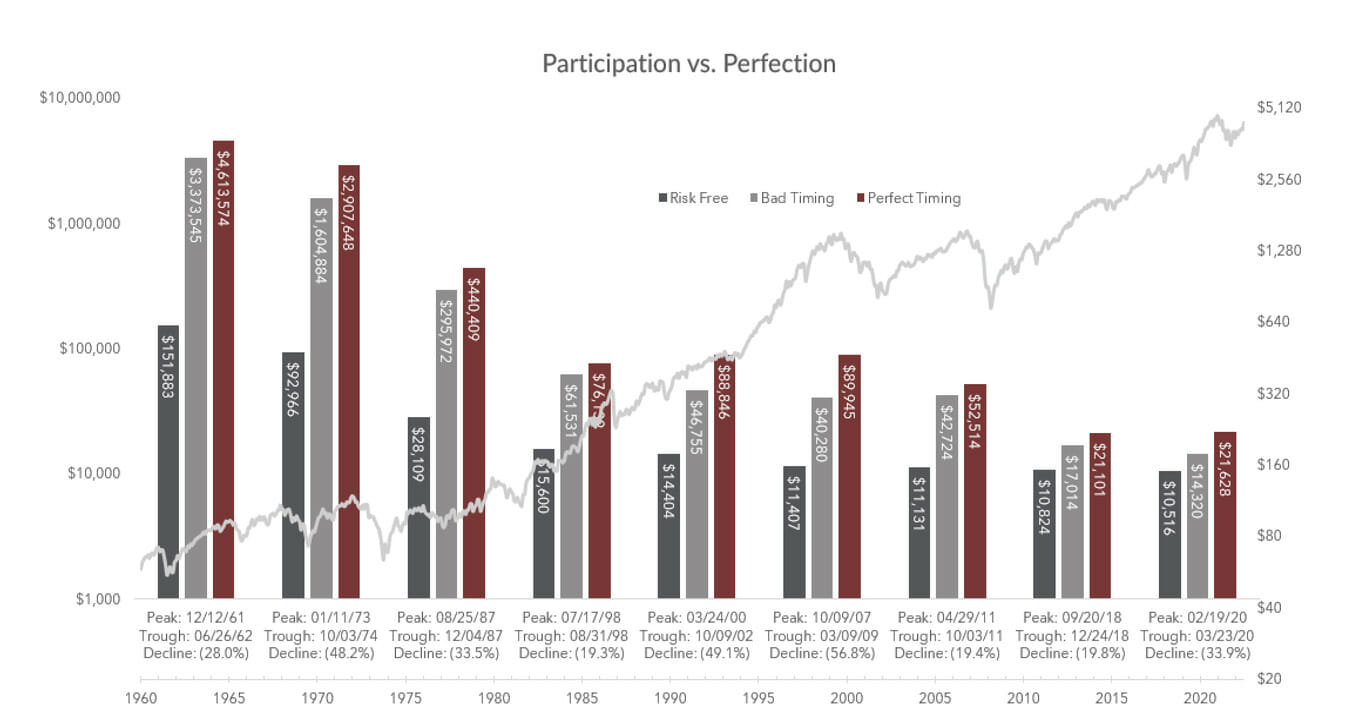
Generally, we’ve found that market participation is more important than perfection. Reviewing the difference between timing the market “perfectly” and “horribly” helps demonstrate this point. Let’s take an investment of $10,000 in the S&P 500 and see how it did during years that fell on the precipice of a stock market correction. Note that the data points show what an investor would have as of July 31, 2023, if they had chosen to invest the $10,000 during each unique starting point rather than keeping money in cash.
Long-Term: Dot-Com Bubble
- Investing in 2000-2002
- Peak: March 2000
- Trough: October 2002
- SP 500 Performance: -49 percent. Some investors’ wealth was almost cut in half.
- Getting into the market with “perfect” timing (October 2002) yielded growth of over $88,800.
- Getting in with the “worst” timing (March 2000) still yielded growth from $10,000 to $46,800.
- The lowest growth of $10,000 still beat cash by about 225 percent.
Intermediate Term: The Great Recession
- Investing in 2007-2009
- The most significant downturn since the Great Depression with the U.S. Housing Market turned upside down.
- Peak: October 2007
- Trough: March 2009
- SP 500 Performance: -57 percent
- “Perfect” timing yielded growth of $89,900.
- The “worst” timing yielded growth of nearly $40,300.
- The lowest growth still beat cash by about 253 percent.
Short-Term: COVID
- Investing in 2020
- Economic gridlock
- Lockdowns
- No end in sight
- Media hysteria
- Cases and deaths peaked in February 2020. The trough came in March 2020, just one month later.
- SP 500 Performance: -34 percent
- “Perfect” timing yielded growth of almost $21,600.
- “Worst” timing yielded growth of $14,300.
- The lowest growth still beat cash by about 36 percent.
Bottom Line
Unfortunately, market drops are part of the deal when it comes to investing. History shows that investment success is typically less about perfection and more about participation. Staying the course in the stock market and driving through the scary headlines can be crucial for investors aiming to achieve their financial objectives. Whenever you find yourself on the verge of panic, think of Cole Trickle driving through the smoke on his way to victory.
This information is provided to you as a resource for informational purposes only and is not to be viewed as investment advice or recommendations. Investing involves risk, including the possible loss of principal. There is no guarantee offered that investment return, yield, or performance will be achieved. Stock prices fluctuate, sometimes rapidly and dramatically, due to factors affecting individual companies, particular industries or sectors, or general market conditions. For stocks paying dividends, dividends are not guaranteed, and can increase, decrease, or be eliminated without notice. Fixed-income securities involve interest rate, credit, inflation, and reinvestment risks, and possible loss of principal. As interest rates rise, the value of fixed-income securities falls. Past performance is not indicative of future results when considering any investment vehicle. This information is being presented without consideration of the investment objectives, risk tolerance, or financial circumstances of any specific investor and might not be suitable for all investors. There are many aspects and criteria that must be examined and considered before investing. Investment decisions should not be made solely based on information contained in this article. This information is not intended to, and should not, form a primary basis for any investment decision that you may make. Always consult your own legal, tax, or investment advisor before making any investment/tax/estate/financial planning considerations or decisions. The information contained in the article is strictly an opinion and it is not known whether the strategies will be successful. The views and opinions expressed are for educational purposes only as of the date of production/writing and may change without notice at any time based on numerous factors, such as market or other conditions,