What’s the most difficult part of investing? We’re looking for a one-word answer here: Loss. When you lose money, it’s painful. There’s a body of science that says the feeling accompanying the loss of money is three-times more potent than the feeling of winning it.
According to Nobel Prize-winning research by psychologist Daniel Kahneman, financial losses produce a visceral response in we humans.
Simply put, the agony of defeat far outweighs the thrill of investment successes. But, these “down times” are also part of the investment game. And we have to understand both the good and the bad times of the market to have a fighting chance at investing.
Enter stock market corrections. In light of recent events, we would do well to understand the meaning and the history of corrections. We need to have a firm grip on their frequency, length, depth and the time it takes to recover from market selloffs. Having a comprehension of these factors helps give us perspective on where we are and where we’re likely headed. Understanding corrections also take us out of the mental fog of loss and into the world of rational thinking. Or, at least that’s the idea.
My hope is that this discussion will help soothe investors’ (understandably) troubled minds.
We’re going to go in-depth on four factors of market corrections: Frequency, length, recovery time and depth. Let’s start at the beginning.
The Frequency of Corrections
Counting the most recent correction that started in September 2018, there have been 53 market pullbacks of 10% or more in the past 90 years. That’s an average of one correction every 1.7 years. Sure, there have been multiyear stretches where we were correction-free – such as from 1991 – 1997, and, more recently, from late 2011 – mid-2015. But, on average, we see a pullback like this every one-to-two years.
Major corrections, a.k.a. bear markets – when the market falls 20% or more – much less common. There have been 20 such full bear markets since 1928. Average that out, and we’ve had a bear market once every 4.5 years.
Unfortunately, the market doesn’t work on an average schedule. (If it did, market timing might actually be a good investment strategy.) But it’s still important to look at where we’ve been to glean as much information as we can about where we may be headed.
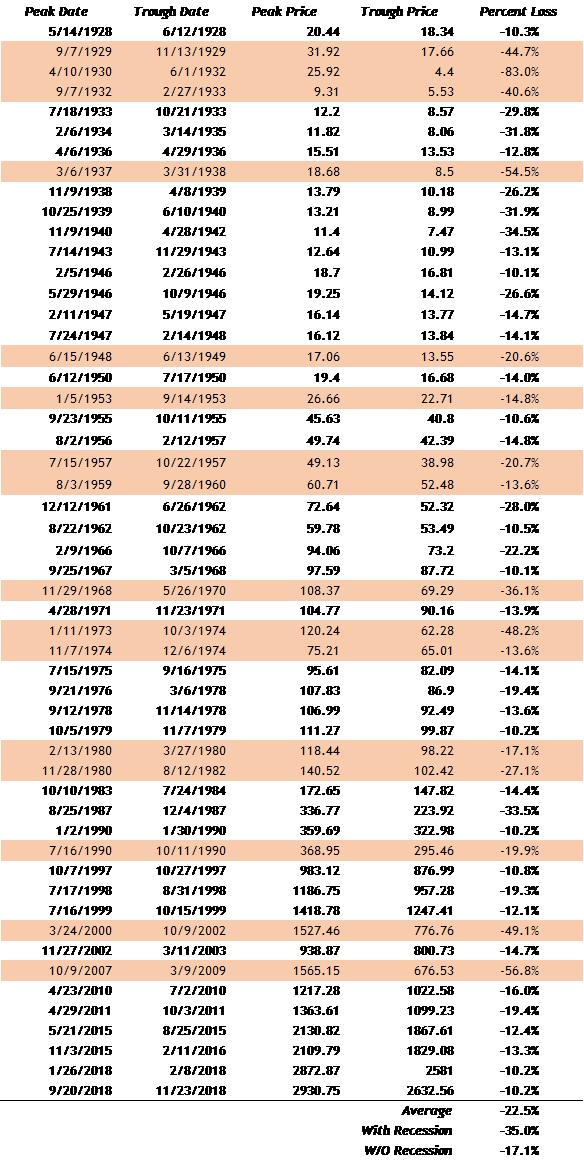
S&P 500 10% Corrections and Bear Markets since 1928
Moving beyond our initial “10%” and “20%” categorization of pullbacks, there are two flavors of stock market corrections we want to consider: Corrections with recessions, and corrections without a recession. In other words, we are going to look at stock market pullbacks that coincide with strong economies, and those that coincide with bad economies.
As you would probably guess, corrections associated with the “Big-R” are far worse than those that happen during good or even decent economic times. Here are some of the numbers:
There have been 11 recessions since 1928 (1929-33, 1927-38, 1948-49, 1953, 1957-60, 1968-70, 1973-74, 1980-82, 1990, 2000-2002, and 2007-2009).
Average of ALL 53 downdrafts: -22.5%
Average correction w/o Recession: -17.1%
Average correction with Recession: -35.0%
So, we see that the average of all of the corrections – from the little cubs of 10% to the massive bears of 20%, is 22.5%. This point is critical to understand, but I find it more informative to break these data down into pools of corrections with recessions and corrections without recessions. This way, we get more insight into the pullback cycle. Why? Because every single time there’s even a 1% correction, the friendly, slightly concerned looking CNBC host will say, “Jim, is this the start of something much bigger?” Every single time, my friends.
Identifying the overarching, or macroeconomic environment is what really helps us address this question. Meaning, specifically, if the current economic outlook is strong and looking stronger, then, when we do go into a stock market pullback, we can have a better understanding of the likely damage.
Again, what’s the likely damage if markets are off 8%, but the economy shows no sign of going into recession? Well, the average damage is 17.1%. It’s crucial to remember that the carnage often doesn’t come close to that 17% level if economic backdrop stays healthy. For instance, in 2015 the max correction pullback was 12%, in 2016 13%, and earlier this year it was 10.2%.
It’s the recession that really wreaks havoc on stocks – when your garden variety pullback turns into a Grizzly bear. When a correction happens during an economic downturn and then becomes a correction recession, the stock market loses an average of 35%. That’s a lot more than 10.2%. See what I mean?
The Length of Corrections
Apart from concerns about the “Big R,” another question on investors’ minds is once we hit a correction, how long it will take to get back to peak and begin to plow new ground.
Our data on those 53 corrections in the past 90 years tell us that on average:
- The 10% – 20% market corrections took about 112 days to reach bottom or about four months;
- The 20%+ market corrections took about 373 days to reach bottom or about one year.
But remember, we don’t want to just conceptualize these as 10 and 20% buckets. We are interested in terms of recession and non-recession corrections, and how long it took the market to recover to its previous peak. After all, once it gets back to “peak shape,” it has essentially canceled out the negative impact of the correction.
Here is another set of data I want to share with you.
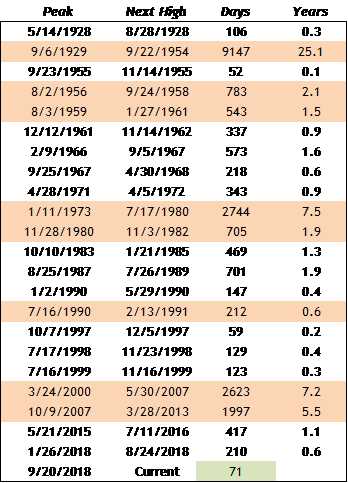
Note that in this chart, we have 23 periods versus our previous 53. There are fewer data points because the clock only resets once the market gets back to its previous high and moves higher, whereas the 53 original points only tracked corrections of greater than 10%.
With these numbers in mind, let’s move on to our next point.
Recovery Time
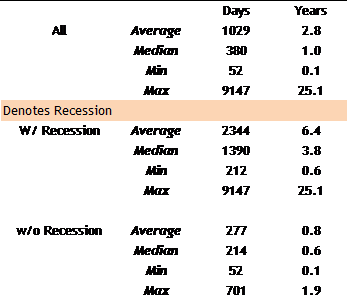
From our second chart, we see that with recession corrections it takes about 6.4 years before we get back to even. But, consider that this number also includes the 25 years we spent with stocks underwater because of the Great Depression. If we exclude this data point, we get an average of 3.8 years to fully recover.
When it comes to non-recession corrections, it takes less than a year to recover, or an average of about ten months, to be more precise.
The Depth of Corrections
And here we are. So far, we haven’t talked about the worst-case scenario – the full blow 50% or more correction. This is what happened during the Great Depression 1930-1932 (-83%), and during the years of 1937-1938 (-84%), 1973-74 (-48%), 2000-2002 (-49%), and 2007-2009 (-56.8%).
Yes, these numbers will make the hair stand up on the back of your neck. They are the boogeymen in our closets. But, remember they all are associated with recessions. And arguably, more than just recessions. One was, after all, a full-blown depression. Another was almost a depression.
Both those epic freefalls were the result of massive imbalances. And I do mean massive. It’s worth noting that once we went through the depression and the last shoe dropped for markets in 1937 (when we were down 54%), we didn’t suffer another 50% tumble for more than 60 years.
I know investors have been burned by two 50% hits in the past 20 years, in 2000 and 2007. As a result of that experience, it can feel like calamity is always lurking just around the corner. But I believe the next massive bear is a very long way off.
Yes, we’ve had ten other corrections in the past two decades, but these were less than 20% pullbacks. Remember, going through a correction every one to two years, while painful, is normal. It’s not until a correction recession rears its ugly head that we need to prepare for financial winter.
Even then, the average correction recession returns to its previous peak in four years (barring a depression). If investors are able, we would do well to use that time to accumulate and accumulate some more. Or, if your investment plan doesn’t have a pullback protection plan baked in (mitigated by a balanced income portfolio), then the way forward through those visceral feelings of loss is through rationality. Understanding corrections, or better yet, understanding the resiliency of the stock market through the darkest of times, gives us the tools to make it through these periods of emotional trial and tribulation.
Bottom Line
Correction recessions are awful. Non-recession corrections are, on the other hand, very bearable.
And that’s where we find ourselves today – in a non-recession correction. Don’t let the emotion of loss blind you to the resiliency of US stocks over time.
We’ve spent a great deal of time talking about the economy and the potential for a recession, and it pays to give a reminder of the three main harbingers of recession: a leading economic index (LEI) near zero, an inverted yield curve; and wage inflation at 4%.
None of these are flashing red, yet. We’re at green, yellow, and green. So, we are safe on the economic front right now. A “Big R” is likely a long way off, as far as we can see. That leaves us navigating a non-recession correction instead of a recession correction.
Given that devil’s choice, we’re doing okay.