As we round the corner into this new year, let’s raise a final glass to 2019. For investors, this year was decidedly strong and, in some cases, record-setting.
The S&P 500 climbed 28.9%, making it the best yearly gain since 2013, and the Dow Jones Industrial Average climbed 22.3%. Because 2019 was such a good year for markets, critics are quick to the notion that 2020 can’t possibly be another strong year.
While it is true stocks will have to take a breather at some point, history shows that if markets are up 25% in a given year, the following year is also positive 67% of the time. I’ll take those odds.
Still, forecasting markets with precision is like predicting the exact number of birds that will migrate south for the winter. While we do have an educated guess of the migration pattern, knowing with absolute accuracy how many birds will make their way down the northern hemisphere is impossible.
Similarly, our study of the behavior of the economy, markets, interest rates and politics for 2020 gives us an informed direction as to where our “economic flock” may be headed.
With this analogy in mind, here are five essential trends we believe will help shape markets in 2020.
#1 – Dual Trade Tailwind
China trade talks continue to garner the lion share of economic and market headlines. We hear about every back and forth word between China, Trump, and President Xi. And getting a Phase 1 trade deal with China at the end of 2019 is a significant development. But it’s worth remembering that the US’s economic commerce with Canada and Mexico dwarfs our trade with China. The numbers tell us the combined trade with our neighbors to the north and the south tallies to over $1.1 trillion. As for China, our trade partnership comes in at around $600 billion.
In December NAFTA 2.0 was signed into law. The new trading construct is named USMCA, or the United States–Mexico–Canada Agreement. This massive new deal will grease the entire North America economic engine in the year ahead. It stands to boost manufacturing and agriculture in the US, thereby providing a “tailwind” for overall economic growth.
Now, pair this with a Phase 2 trade deal between the US and China, and we would see a true dual trade tailwind from both North America and Asia.
For the better part of two years now, we’ve had a headwind on almost $2.0 trillion of economic trade. But, now that we have a deal in place with the USMCA, this could add a full 0.5% to our nation’s annual GDP. An expanded deal with China could easily add another 0.25% to annual US economy growth*. Both are steps in the right direction, and an extra 0.75% to US GDP growth is significant. Thinking of it in terms of a $21 trillion economy, every 1% increase in growth is more than $200 billion in economic output.
#2 – Little Risk of Recession
It’s difficult to see a recession emerging in 2020 with the winds of trade at our backs. Instead, because of the trade-economic tailwind, we could potentially see the US economy grow in the 2.5% to 3% range.
Consumer spending is in very good shape. According to Mastercard, this indicator was up 3.4% year-over-year for the Holiday season in 2019. Online sales are even more impressive, up almost 20%. This led by Amazon, which reported its biggest holiday shopping season ever.
As for manufacturing, this economic indicator sits at just below the flatline of 50, at 47. We could see this number pick up with the lifting of trade uncertainty. And the non-manufacturing gauge, which represents a much larger piece of the US economy sits at 55. This is both well into expansion territory and marks the highest level in four months. As for interest rates and inflation, both remain low and in check. The Federal Reserve (FED) has been emphatic that they stay on hold with interest rates, keeping borrowing costs very low by historical standards.
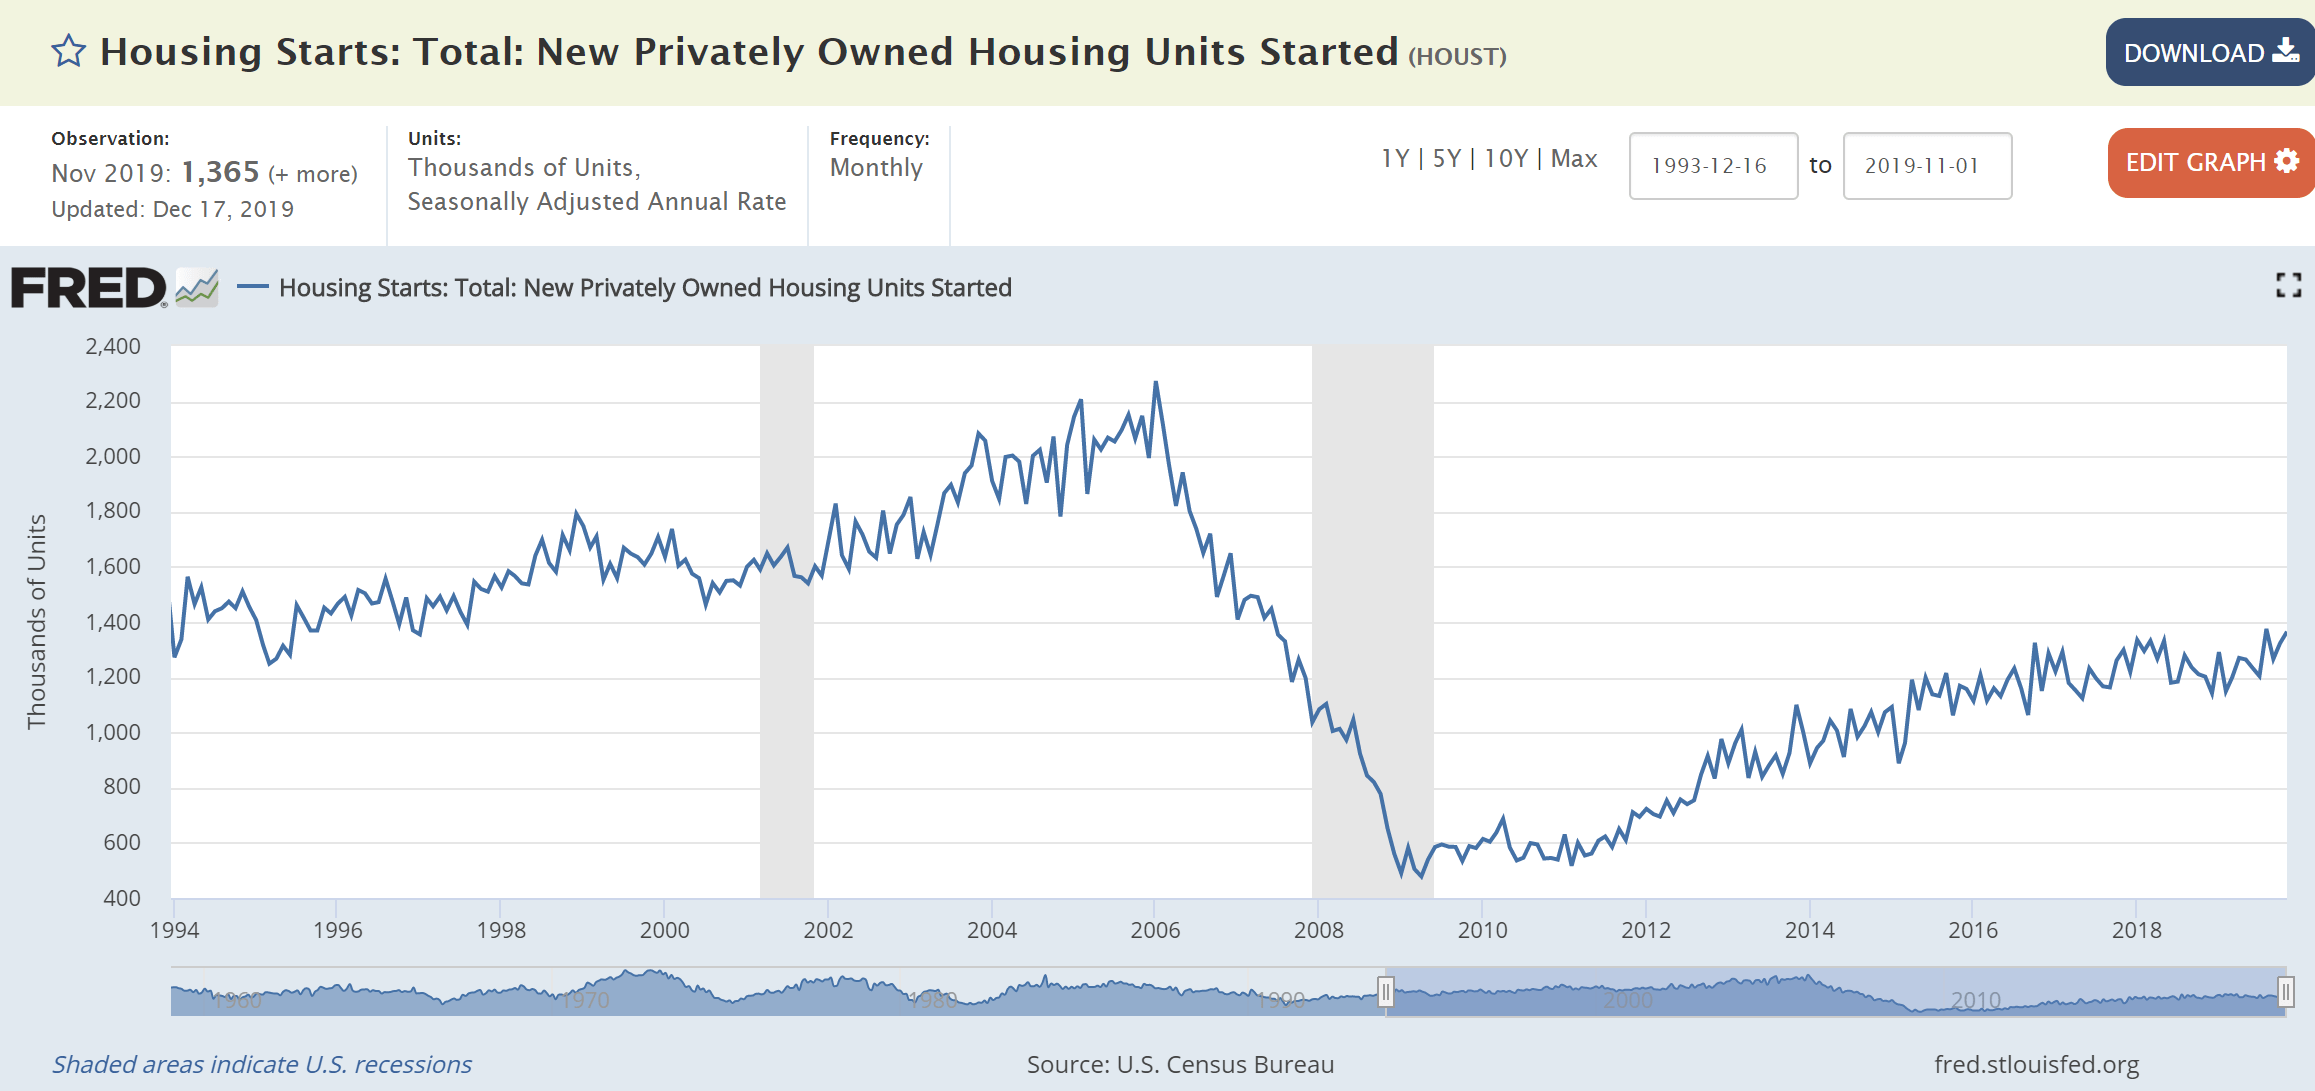
The following charts will help illustrate several positive economic trends.
The US Consumer
Household Financial Obligations as a percent of personal income has dropped dramatically showing the US consumer is not overextended.

Rising Housing Starts – continue to climb at a steady pace while showing no signs of excess.
Unemployment sits at 50-year lows.
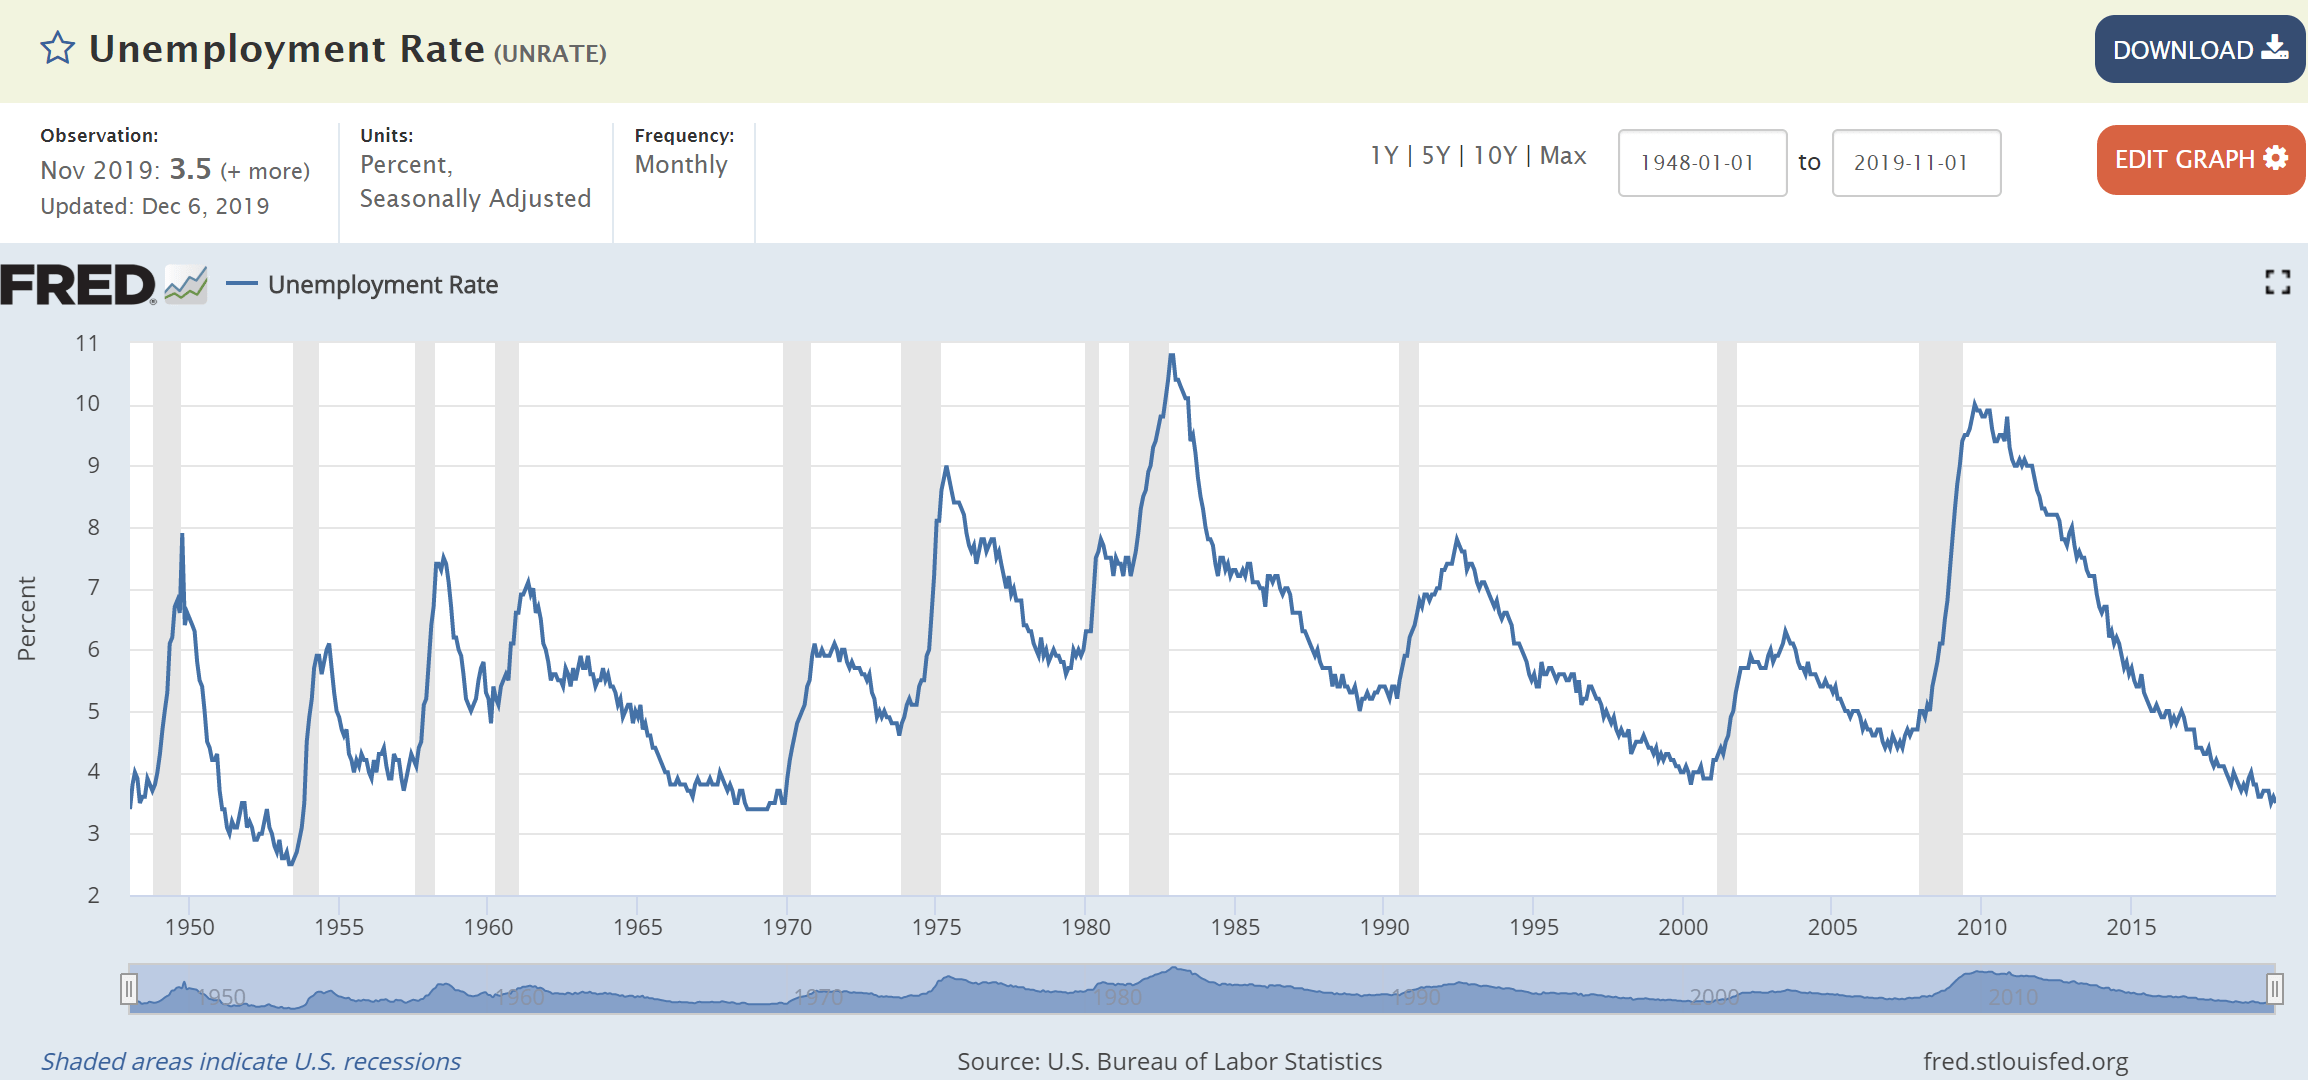
Charts above sourced from: fred.stlouisfed.org
#3 – A Boring Fed is a Good Fed
Jerome Powell and the FED have repeatedly indicated that they like the current level of interest rates. Much of this rationale stems from the elements discussed above – the dual trade tailwind and moderate to strong economic data in the US. Officials at the Fed recently unanimously voted to leave interest rates unchanged – in the target range between 1.5% and 1.75%. They have also signaled it would require a material change in our economic outlook or circumstances to either raise or lower borrowing costs.
“We are looking for the economy to continue to grow, labor markets to continue to be strong,” said Charles Evans from the Chicago Fed. He added that he is comfortable with leaving rates where they are through 2020, followed by one rate hike in 2021 and another in 2022.
#4 – The Strong US Economy Gives Trump’s Re-election a High Probability
If you want some insider knowledge on the next presidential election results, keep an eye on the following data point – the After-Tax, After Inflation Income Growth (ATAIIG). This number is the strongest economic predictor for any incumbent’s chances at re-election, according to Dan Clifton, head of Policy Research for Strategas Securities, LLC.
What we’re looking for here is to clear the bar of a 1.4% value for ATAIIG. Make it above this hurdle, and the incumbent is likely to get re-elected. Fall below it, and chances are the incumbent will be defeated.
Currently, ATAIIG sits at almost 1.6% and has hovered in the 2.0% range since 2017. If these levels hold, based on economic and political history, it will be difficult to unseat President Trump.
Here’s what this historical guide shows us: We re-elected George W. Bush at the 1.4% income growth level, Bill Clinton and Barak Obama each at 2% income growth, Reagan at 3.5% income growth, Johnson and Nixon in the 4.5% to 5.5% income growth range. Income growth below the 1.4% threshold led to a loss of re-election for George Bush, Sr. and Jimmy Carter.

Chart: Strategas Securities, LLC
We can also look to the stock market to get a glimpse of who may sit in the Oval Office next term. Much better than the polls and the pundits, the S&P 500 has predicted the presidential election winner 87% of the time since 1928. Looking back, if the S&P 500 was higher in the three months leading up to the election, the incumbent party won. And, if stocks were lower during the same time, the opposition party won. This point has been true in every presidential election since 1984 and 87% of the time since 1928. So, starting in August of 2020, keep watch over the S&P 500 to see who the odds favor.
#5 – Presidential Stock Market Forces Reign True
Presidential elections themselves have generated an average of a 6.3% price return and have had the smoothest quarterly profits over the four-year terms. And, re-election years are much stronger for markets versus the open presidential election years. Since 1936, presidential re-election years have averaged a 10% gain, while open years have averaged closer to just 2%.
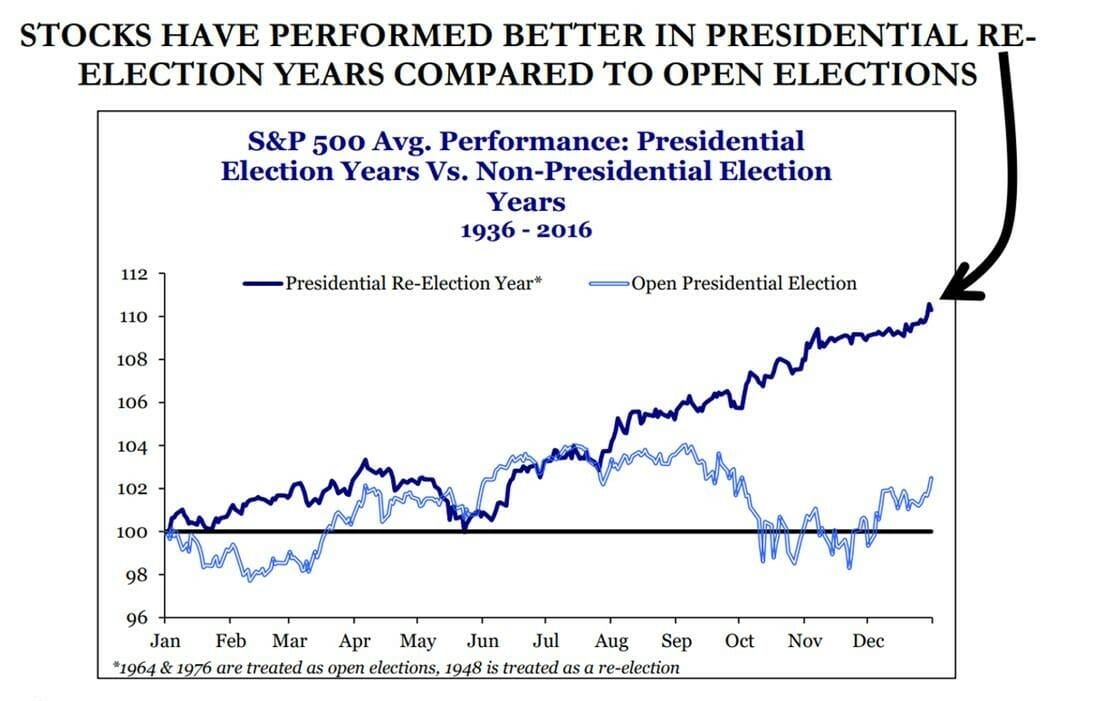
Chart: Strategas Securities, LLC
Looking at past presidential cycle stock performance proved a venerable guide for 2019. At Capital Investment Advisors, my colleagues and I were adamant about the power of the third-year presidential cycle. We know that, on average, the third-year period of a presidency has been up 16.1%, more than double any of the other three years.
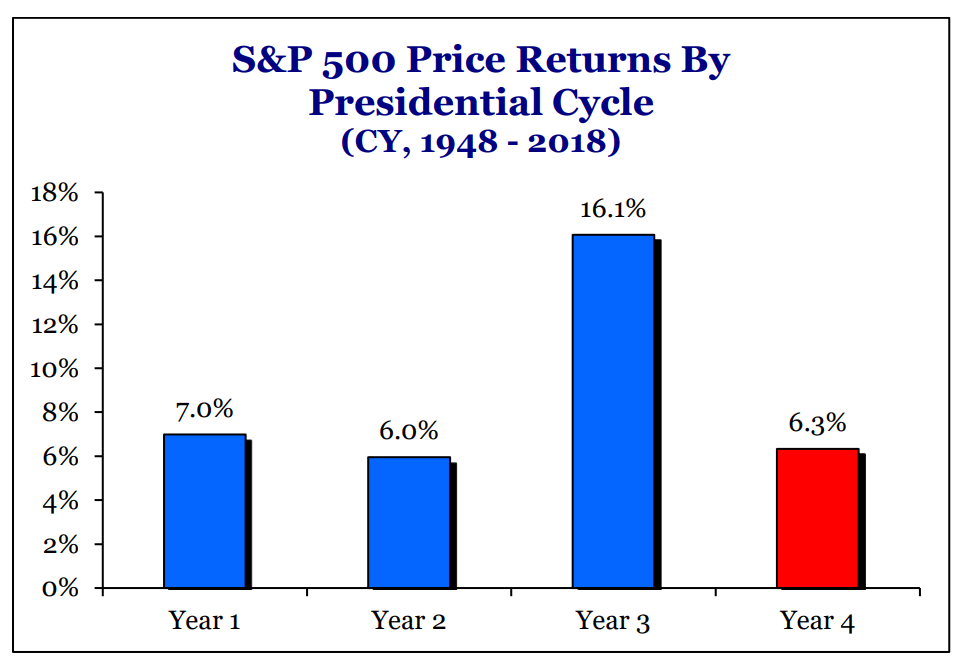
Chart: Strategas Securities, LLC
Due to trade negotiations, President Trump has had more influence than any president in history. And, our historical guide was very much on the money last year – the S&P 500 was up over 29%. So, I think it’s smart to continue to take this historical indicator seriously. President Trump has an eye for the stock market.
With every New Year comes new possibilities. Instead of a new chapter, though, I think of 2020 as a “renewed” chapter. Trade relations will remain in the headlines but should shift from a headwind to a tailwind. This impact will help to dramatically reduce the chances for a recession in the year ahead. Consumer confidence is still solid, and interest rates are low and likely stable. All these factors add up to exciting possibilities in 2020. Our investment committee here at Capital Investment Advisors is eager to see exactly how they unfold.
*As for a bump in US GDP from a US-China deal, National Economic Council Larry Kudlow states that a “deal with China could take US GDP from 2% all the way to 3%” according to a report from Dan Clifton, head of Policy Research at Strategas Securities, LLC. Saying a ‘Phase 1’ trade deal could add .25% to GDP is a conservative estimation based on Kudlow’s “full 1%” notion.
1 Comment