For months, we’ve been discussing how to wring benefit from the flurry of political activity in Washington for our investment portfolios. While investors have enjoyed a positive run across major indices under this administration, outside of general bullishness on Aerospace and Defense we’ve yet to identify ways to capitalize on the policy activity within our nation’s capital.
But that now changes with the Policy Opportunity Portfolio.
This portfolio represents a basket of domestic companies that outpace their peers in a metric known as lobbying intensity.
The portfolio is comprised of 50 equally weighted companies, rebalanced quarterly, that are particularly savvy in their lobbying efforts. The ranking takes into account not only dollars spent but spend relative to revenues, PR investment, shifts in public awareness and other areas to reflect exceptional effectiveness in lobbying efforts – and thus, the potential for a future benefit to earnings.
The portfolio’s rationale is this: research shows that lobbying activity and intensity favorably impact company earnings. By tracking companies that are shaping policy, driving industry legislation and furthering beneficial regulatory processes, investors can capture the profit these policies will eventually unlock before the success is known to the broader market.
Finding Those That Profit from Policy
Developing a lobbying ROI metric is not as simple as pegging influence and likely upside to dollars spent.
Google, for example, spending $10M annually on lobbying has far less potential revenue impact than Vertex Pharmaceuticals spending the same amount. Google’s parent, Alphabet has a nearly $800 billion market cap with $90 billion in annual revenue. Vertex is a $40 billion company delivering under $2 billion in revenue annually.
While dollars spent is compelling, it’s not a way to figure out which companies are poised to outperform. Following corporate lobbying spend is not new, and figuring out the biggest corporate lobbyists is just a Google search away. But markets and research analysts have traditionally struggled to appropriately price and estimate the bottom line impact lobbying can have.
And this is a puzzle worth solving.
Harvard Business Review features research showing that corporate lobbying efforts can have a major impact on earnings. This case study shows how one dollar spent on lobbying for tax breaks returned in excess of $220. So it is clear that lobbying efforts can help earnings, but Wall Street analysts seem to have trouble figuring out when this will take place. This is why identifying this group of companies is so compelling.
The Unexpected Upside of Lobbying
Savvy firms are often ahead of the prevailing market view when it comes to how policy and regulation will impact operations. Unexpectedly, for example, strict regulation, while decried by critics of free-markets, may prove beneficial for industry incumbents. When investors get a whiff of pending environmental regulation, they run for the hills. It’s assumed that affected firms become worse off. Not always, one study on pollution regulation suggests.
In some cases, stricter regulatory environments become barriers to entry for new competition, giving existing companies a bigger advantage. Big tobacco offers a great example of this. In 2005-2006, companies were struck by waves of class-action lawsuits. These companies pushed hard for regulation and reform, recognizing that the dollar impact to advertising and operations would be less than the lawsuit protection afforded by the new regulation. Limiting advertising visibility, plus new taxation schemes, also became barriers to potential competitors, too.
Check Out: 8 Emerging Economic Trends To Watch In 2018
A Proven Track Record
The Policy Opportunity Portfolio deploys a strategy that has proved consistently successful. With a track record since April of 2009, it has outperformed the S&P 500 by nearly 4% per year on average since inception (20.6% vs 16.8%). On a year-to-year basis, it has eclipsed the S&P 500 in 8 out of 9 years.
The Policy Opportunity Portfolio has also been backtested to 2002, and it has sustained its performance versus the index. As well, the portfolio has even shown itself insulated against new administrations and party impacts.

What does this mean?
It means that regardless of which party controls the White House and Congress, the factors that determine a company’s inclusion in the index remain unaffected. These metrics uncover companies that find success in Washington, no matter the current political climate.
The investment ideas most often thrown about during election time are little more than wagers on one political party’s success. This is the beauty of the portfolio; it’s not a bet on ballots.
While delivering solid performance, the portfolio is remarkably simple, featuring just 50 stocks – all large cap – and a solid mix of dividend producing and growth companies.
Some examples of companies that have spent time in the portfolio.
Cummins Inc. (CMI)
The Fortune 500 company designs, manufactures, sells and services diesel and alternative fuel engines. The current dividend yield is 3.6%, with growth between 25% and 30% for the past 1, 3 and 5 year terms. Remarkably, their free cash flow covers the dividend by more than 2X.
Boeing (BA)
The world’s largest aerospace company and leading manufacturer of commercial jetliners and defense, space and security systems has a dividend yield of 3.4%, with 20% to 30% growth rate for the past 1, 3 and 5 year terms. They have a net cash position and certainly positioned to raise the dividend.
Qualcomm (QCOM)
The semiconductor company makes chips for everything from Kyocera printers, Motorola phones and other hardware companies’ products including Microsoft, Sony and Samsung. Their dividend yield is 3.8% and they have grown it 15% to 25% annually while maintaining positive net cash.
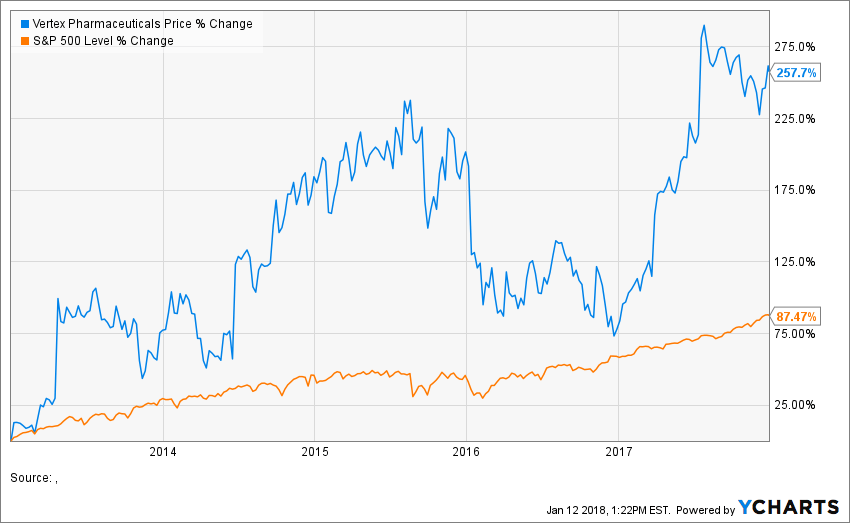
The portfolio also features a selection of growth-oriented stocks that exert strong Washington influence while aggressively pursuing growth strategies. One example I brought up earlier is Vertex Pharmaceuticals. Vertex was added to the Policy Opportunity Portfolio in 2013. As the chart below indicates, VRTX has returned over 250% since 2013, compared to 87% for the S&P 500.
Yes, But Is Active Management Alive Anymore?
The skeptics out there will point to the decline in active stock picking and management as a viable investment strategy. While passive strategies have enjoyed a solid run, consider the abnormal environment that has contributed to their success. Recent federal government intervention, bailouts, and suppressed interest rates have created an artificially tough climate for active managers. Liquidity policies that keep market volatility unnaturally low make it hard to find ways to beat the general market, as even borderline companies have seen decent stock returns.
The old saying, a rising tide floats all boats? Well, that can be true in investing as well. But as monetary policies change, expect active strategies to pick up steam again.
Interested in Learning More? The Policy Opportunity Portfolio is simply a group of 50 companies working harder and smarter in Washington. If you would like to discuss this opportunity or learn about how the portfolio may fit within an IRA, Roth or regular brokerage account, please reach out to me through the contact page at www.WesMoss.com.