There’s no exact dictionary definition for Asset Allocation. It’s Finance 101 jargon, sure, but it’s also essential for portfolio health and few really understand it. The average investor knows what an asset is (money or possessions that have economic value) and even what allocation is (the act of distributing or spreading something around), but the two together are lesser known, often wrongly defined and haphazardly applied in retirement portfolios.
The point of this article is to change that.
I’m going to walk readers through the complexities of this investment concept and reinforce its importance as a basis for portfolio construction.
Put simply: asset allocation is a means to balance risk and reward by adjusting the percentage makeup of a variety of core asset classes (e.g. – stocks, bonds, cash) across the investable landscape in an investment portfolio. Asset allocation is a way to implement the universally popular idea of diversification, which is the concept that encourages adding a higher number of investments within a specific asset class and portfolio. But it is not the same thing.
To understand the role of asset allocation in sound portfolio construction, consider what it looks like relative to its peer concept of diversification:
Example of:
- Diversification: investing in twenty technology stocks versus one technology stock
- Asset Allocation: investing in five assets classes in three separate areas of the world versus investing only in U.S. stocks and bonds
Assuming common retirement goals, portfolio construction will employ both of these concepts with asset allocation operating as a foundational guiding principle.
The most common asset classes present in retail investment portfolios are stocks, bonds (or fixed income investments) and cash. Conceptually, asset allocation suggests that the asset mix – or assigned percentage – of each class will determine the portfolio’s return variability. Note, I said “return variability” not “return”. This is a highly misunderstood idea, but one that is important to grasp. The various asset classes each possess a level of volatility and have varying correlation to one another, thus investors can construct their portfolio to absorb and flex during big market swings while, ideally, still generating reasonable performance.
How We Got Asset Allocation.
The beginnings of asset allocation date back to 1952 with a landmark paper written by Harry Markowitz, who went on to become a Nobel Prize winning American Economist, but more on that later. A more modern idea of asset allocation was introduced to the mainstream in a 1991 paper titled, Determinants of Portfolio Performance II: An Update by Gary Brinson, Brian Singer, and Gilbert Beebower. The paper covered the authors’ study of large pension fund portfolios from 1977 to 1987. The paper’s findings suggest that “investment policy” (now referred to as “asset allocation”) explained 91.5% of the variation of total investment returns in a portfolio over a period of ten years. It showed, as one would expect, that two pension funds with the same percentage mix of stocks, bonds and cash would be expected to have a similar standard deviation over time.
[For some, the two words, “standard deviation” elicit nightmares of undergraduate statistics. Fear not! For our purposes, the term simply references the historical volatility of an investment. It is a measurement of how much and how often an investment deviates from its normal, expected returns and sheds light on the amount of expected volatility.]
Many will read that paper… actually, few will ever read the paper, but if they did, they’d interpret the results as over 90% of a portfolio’s returns are dictated by the mix of asset classes being invested in. This is incorrect. Asset allocation and asset class mix instead drive how volatile the portfolio’s returns will be. They are not the primary determiner of performance. Investors perceive these concepts as the same and it’s a mistake.
Volatility measures the riskiness of an asset. Stocks are more volatile than government treasury bonds, for example. Performance becomes the total return produced by that asset and generally, assets with greater volatility have greater expected return over the long run. Understandably, the buzz around asset allocation took off. Investors had an easily applied principle that reduced the role of volatility in impacting returns and allowed a risk-adjusted approach to building a smarter portfolio.
What does Asset Allocation look like in practice?
Quite simply, if a portfolio is built around a variety of core investment areas that move independently of one another then, together, these can smooth out returns and help drive returns inline with the inherent risks of the collective assets in the portfolio. We’d call these assets uncorrelated and their return profiles would offset or react differently to market changes, for example, to drive consistency within the portfolio.
Here’s a simple example –
U.S. blue-chip stocks could crater on a given day and drop 1.5%. On that same day, government bonds may rally .5% as investors’ cash rushes out of equities.
In practice, a portfolio may likely include core investment areas beyond just stocks, bonds, and cash. Other asset classes that can affect the portfolio’s expected return could include commodities, real estate, private equity, derivatives or art, and collectibles, etc. Within common asset classes like stocks or bonds, there could be further distribution. Investors could hold U.S. stocks, general international stocks, or even emerging market and frontier market stocks. Their portfolios may include corporate bonds, U.S. government bonds or municipal bonds. Introducing any variety of these within a broader asset class offers levels of diversification.
By allocating assets across a variety of classes investors may insulate themselves from taking unnecessary risk that lacks commensurate return. Too many investors look at the headline number: “Wow, this mutual fund gained 15% last year. It must be better than the one that gained just 8%!”. But in reality, it depends on how much risk was involved in generating those returns. The more risk, the less the returns are worth. That same portfolio may be constructed with a massive standard deviation and in such a way that +30% or -20% are both as likely.
Applying the concept of asset allocation over time should, theoretically, make your portfolio more “efficient”. Portfolio theorists dub this the Efficient Frontier – based on the work of aforementioned Dr. Harry Markowitz. Defined, it is the right mix of stocks, bonds, REITs, commodities and other investments that provide an optimal rate of return for the level of acquired risk. This frontier is an obvious target because it means that you own the most efficient investments; or those such that no other investment offers a higher return for the same amount of risk.
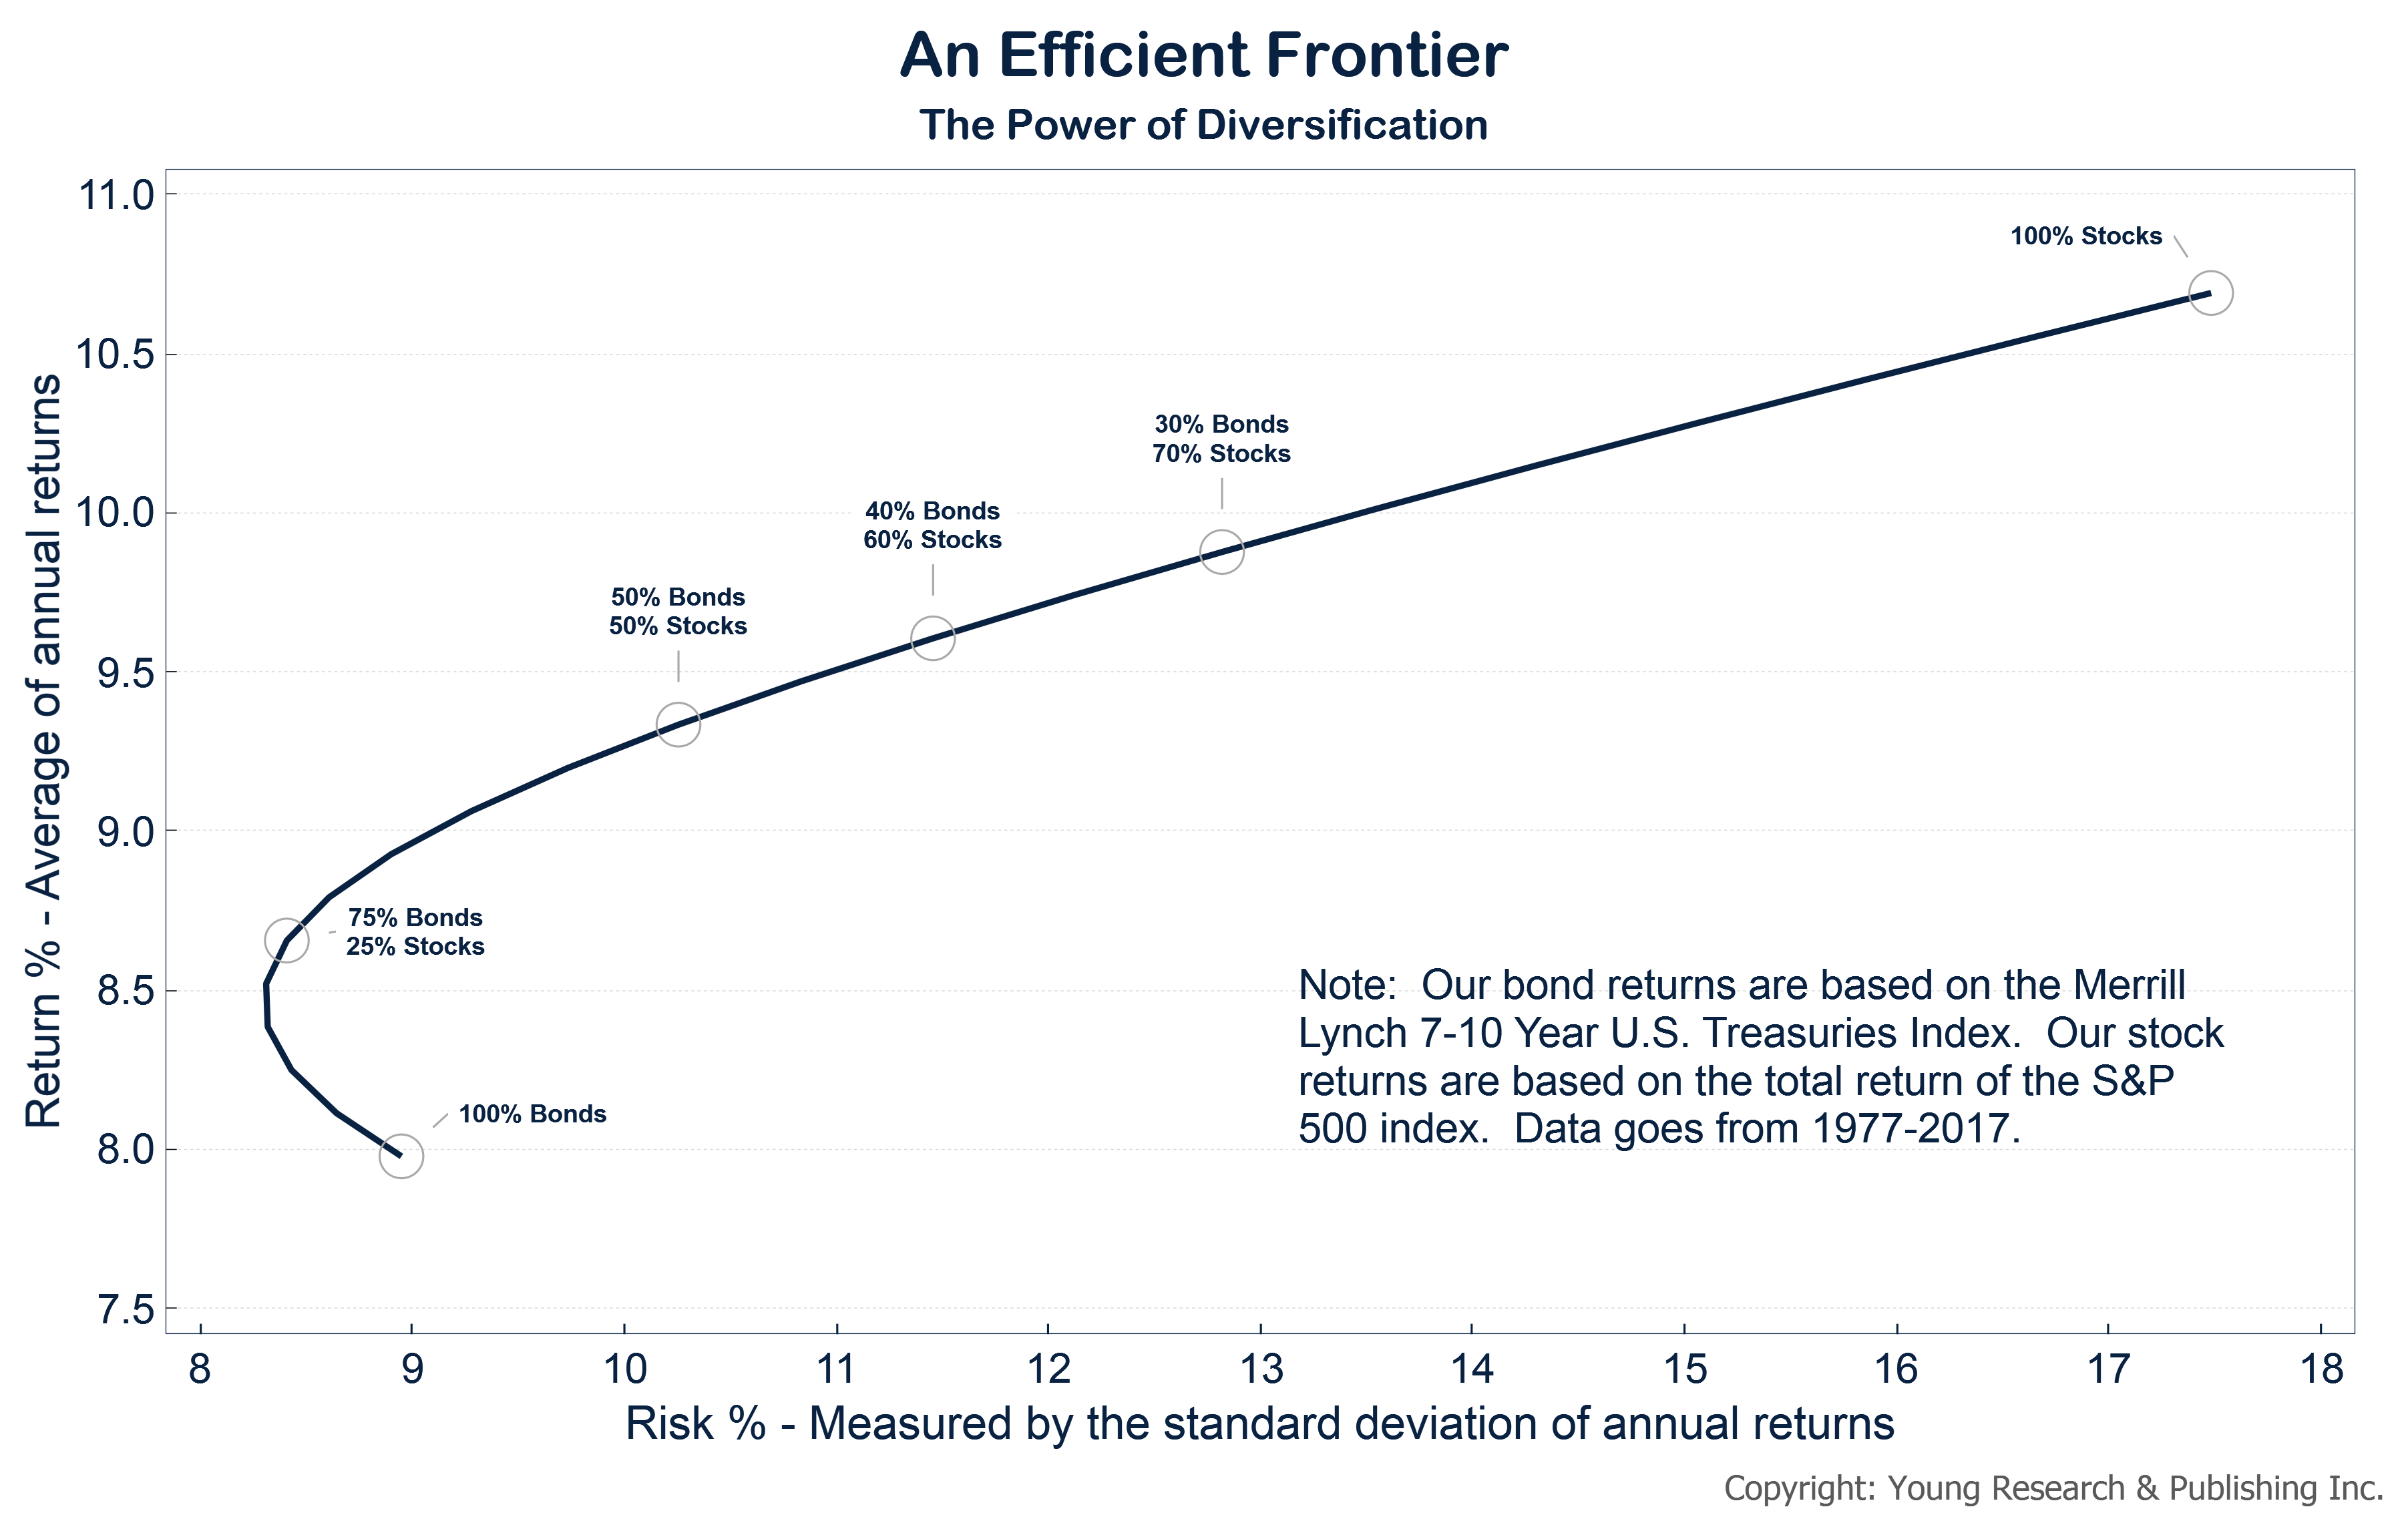
The following figure displays the nature of the efficient frontier curve. With return running along the “Y” or vertical axis and risk along the “X” or horizontal axis, the optimal mix is theoretically right along the line.
As another investment resource reminds us – The optimal portfolio does not simply include securities with the highest potential returns or low-risk securities. The optimal portfolio aims to balance securities with the greatest potential returns with an acceptable degree of risk or securities with the lowest degree of risk for a given level of potential return.
Curious investors will ask: “Wes, does asset allocation ensure that I earn a maximum rate of return?”
The answer is no.
But for most people, this is a good thing.
Asset allocation creates a blend of various asset classes each with a theoretical rate of return. There is no way that these together will ever outpace the maximum performance potential of any one high-flying asset class. What asset allocation does though, as discussed, is help you maximize your risk adjusted rate of return. You can keep your portfolio constructed to help absorb the shocks of massive market movements while still targeting reasonable returns. See, everyone wants the nearly 600% returns the S&P 500’s financial sector has delivered since March 2009. But those portfolios, if all-in on financial stocks to get that return, would have sustained the nearly 90% beating the sector took on the run-up to March of that year. This is why diversification and appropriate asset allocation that drives healthy risk adjusted returns matters.
So, what’s the right mix?
Determining an approach to asset allocation that is personally right depends on your appetite for risk. Can’t stomach volatility, or have a shorter target investment horizon? Consider lower standard deviation asset classes like bonds or cash. More aggressive investors that have the stomach and timeframes for higher volatility may tend to favor a stronger mix of equity-like classes including stocks, REITs or MLPs.
Below I’ve provided a few examples of market returns for a portfolio with a very basic application of asset allocation:
- In 2002, the S&P 500 dropped 22%, while bonds were up 15%.
- In 2008, the S&P 500 was down 37%, while bonds were up 20%.
- In 1981 the S&P 500 was down 4.9%, while bonds were up 8.2%
So how does a $100,000, 50% stocks 50% bonds portfolio perform in these same trying historical periods?
- 2002 – down 3.5%
- 2008 – down 8.5%
- 1981 – up 1.6%
While not ideal, portfolios can live with this performance. Here, participation in very different asset classes offers a buffer against major asset class and market declines.
The bottom line on asset allocation
Asset allocation is likely the most important form of diversification: it’s the diversification of asset categories. For many, this approach will offer more stable, consistent and less erratic portfolio performance, and ultimately act as an emotional buoy when certain asset classes take a hit.
This, cannot be overstated. And as September 2018 marks the 10 year anniversary of the collapse of Lehman Brothers bank and the financial crisis, it is a healthy reminder that staying emotionally sane is critical to “staying the investing course”. When investors panic, get frustrated or overwhelmed, they tend to react to the extremes. They’ll overcompensate and become defensive, reducing exposure to potentially strong, risk-adjusted returns. Or, they’ll overreact looking for upside and expose themselves too aggressively to risky asset classes. The gettin’ may be good until it’s not.
Asset allocation will keep you on course and sleeping well. Even if your portfolio isn’t perfectly optimized every day (e.g., doesn’t sit squarely on the “efficient frontier curve”), well-maintained allocation over 5+ asset classes will take you a long way toward better risk adjusted returns. Don’t burn yourself out trying to time your entrance and exit in and out of asset classes. A sustained balance is your friend.
But, don’t take my word for it.
Consider the approach of Benjamin Graham, the Columbia Business School professor widely known as the father of investing, a forerunner to Warren Buffett and author of The Intelligent Investor, one of the most revered financial books of all time. He advocates for a simple 50% stock and 50% bond mix. This approach is favored by Vanguard founder John Bogle too and is an ideal makeup for generally conservative investors.
In this simple formula, the stock portion can be made up of either dividend-payers (my personal preference) or growth stocks. The trick is to just keep an eye on stock growth and re-balance regularly to ensure the class doesn’t far exceed 50% of the portfolio’s total value. As Mr. Graham explains:
“When changes in the market level have raised the common-stock component to, say, 55% the balance would be restored by a sale of one-eleventh of the stock portfolio and the transfer of the proceeds to bonds. Conversely, a fall in the common-stock proportion to 45% would call for the use of one-eleventh of the bond fund to buy additional equities.”
As a final closing word, I find it helpful to visualize the performance of asset classes over a relatable period of time. This helps investors see how participation in asset classes may shield the portfolio from excessive swings while still capturing return potential.
In the graphic, each colored box represents investments across asset classes (stocks vs.bonds), investment styles (growth vs. value), capitalizations (large vs. small), and equity markets (U.S. vs. non-U.S.). It shows why efficient allocation and diversification within each class matters.
For a taste, look at what the Bloomberg Barclays US Aggregate Bond Index (circled, in pink) did in consecutive years from 2008 to 2011. In 2008 it was the number one performing index, then the worst performing index two years in a row, then again returned to being the best performer in 2011. This is a clear reminder that while asset class variability is significant even year to year, the right portfolio mix can still help a portfolio deliver.
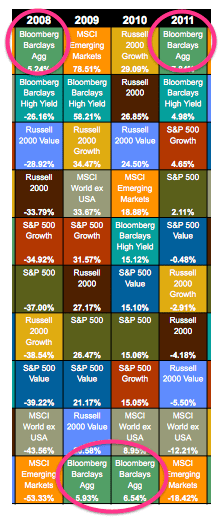
[For a full view of the table displaying how the various indices performed from 1998 to 2017, click here.]